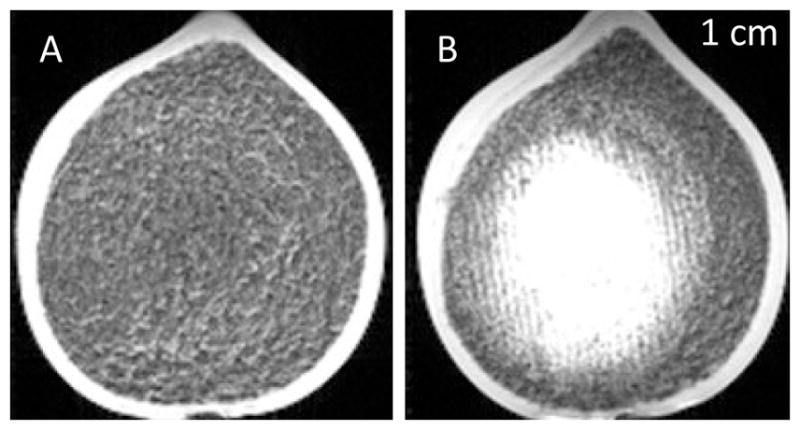
Figure 6. Pre- and Posttreatment Clot MRI.

T2-weighted MR images of pre- and posttreatment clots for treatment with the 500 kHz array with lattice focal point spacing of λ/2. In the pretreatment images, the clot appeared uniformly dark. The posttreatment image showed a bright region approximately 4 cm in diameter that corresponded to the lysed blood cells in the liquefied clot. The bright region was densest in the center portion and became less so toward the periphery of the clot.
