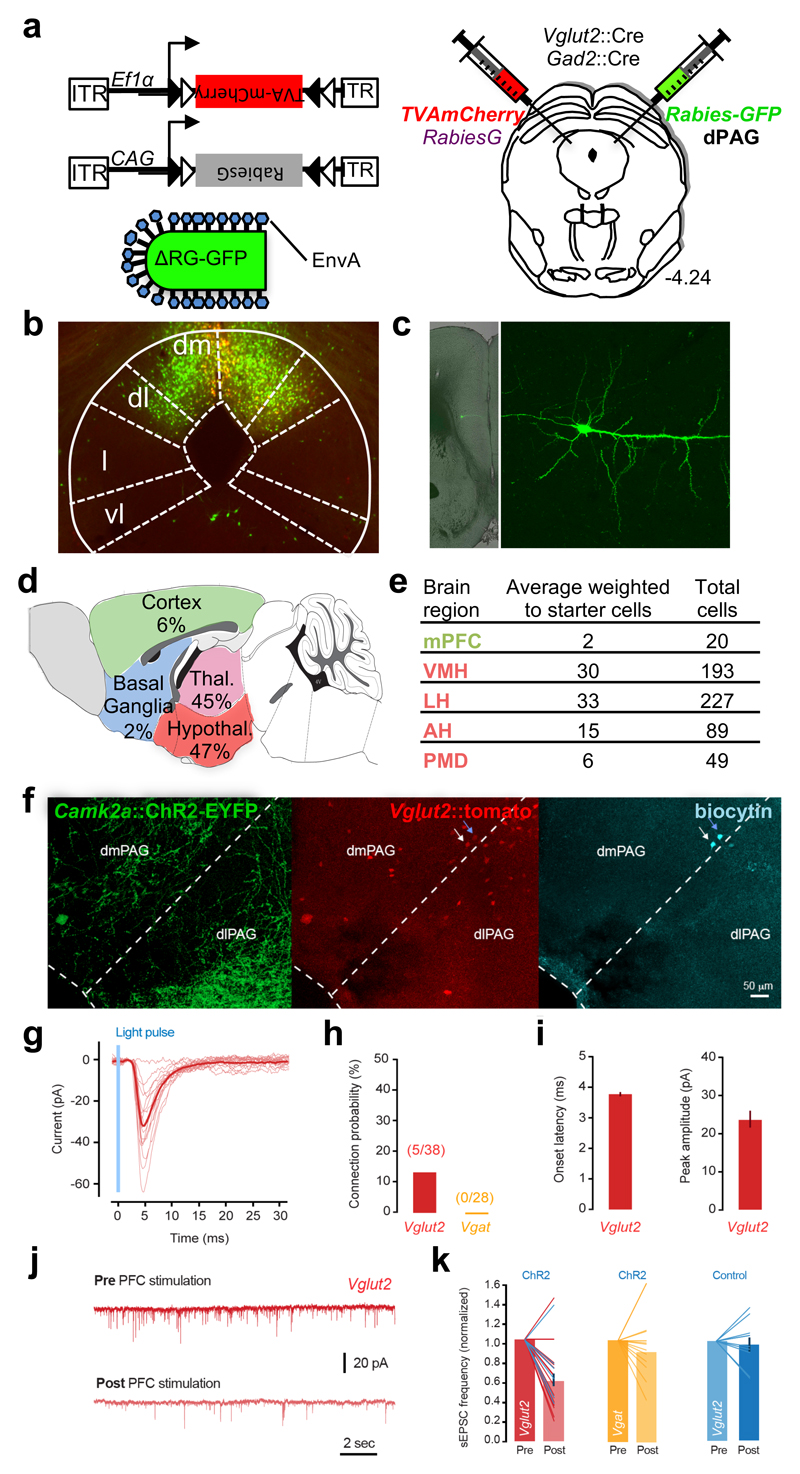
Figure 6. Cell-specific retrograde tracing identifies targets of PFC projections in PAG.
(a) Vglut2::Cre and Vgat::Cre mice were infected in dPAG with Cre-dependent AAV expressing TVA-mCherry and rabies protein G and subsequently infected with EnvA pseudo-typed G-deleted rabies-GFP virus whose infection is limited to cells expressing TVA and that can form viable virions only in cells expressing protein G. In this manner infection by rabies-GFP is limited to cells expressing Cre and trans-synaptic infection occurs only monosynaptically. AAV and rabies were injected unilaterally into dPAG from opposing angles to avoid co-infection of the pipette tract. (b) Cre-dependent targeting of TVA-mCherry (red) and rabies-GFP (green) to Vglut2+ neurons in dPAG. (c) Low (left) and high (right) magnification images of a retrograde labeled rabies-GFP infected layer V pyramidal cell in mPFC. (d) Summary of rabies-infected neurons (GFP+, mCherry-) in the forebrain of Vglut2::Cre animals (percentage of the average number of retrograde neurons weighted to the number of starter cells present in each animal). (e) Number and weighted average of rabies-infected neurons in mPFC and hypothalamic nuclei (VMH, LH, AH and PMD) of Vglut2::Cre animals (n = 8). (f) Example images showing dense ChR2+ axonal projections (green) from the PFC in the PAG, cell bodies of Vglut2+ neurons (red) and two neurons filled with biocytin and processed after whole-cell recording (cyan). Blue arrow points to a neuron with monosynaptic input from the PFC and white arrow indicates a neuron without PFC input. (g) Light-evoked monosynaptic EPSCs in a Vglut2+ neuron. Light red traces are individual trials and dark red is average. (h) Mean probability of detecting PFC inputs in Vglut2 and Vgat neurons. (i) Average EPSC onset latency across all cells (left, 3.6±0.14 msec) and response peak amplitude (right, 23.1±4.5 pA). (j) Example traces of spontaneous EPSC recordings in a Vglut2+ neuron that did not receive direct PFC input, before and after 20 trials of ChR2+ stimulation (20 pulses at 10 Hz) of PFC terminals, showing a decrease in sEPSC frequency. (k) Mean change in sEPSC frequency with PFC ChR2 stimulation for all Vglut2+ neurons (left, 58.5±6% or control, P<0.0001, n=25) and Vgat+ neurons (middle, 91.4±8% of control, P=0.34, n=12). Right, light stimulation without ChR2 infection does not change sEPSC frequency. Lines show individual datapoints; in the left panel blue lines are cells with direct PFC input.

