
Figure 1. Characterization of Arc-Gluc Fusion Protein.
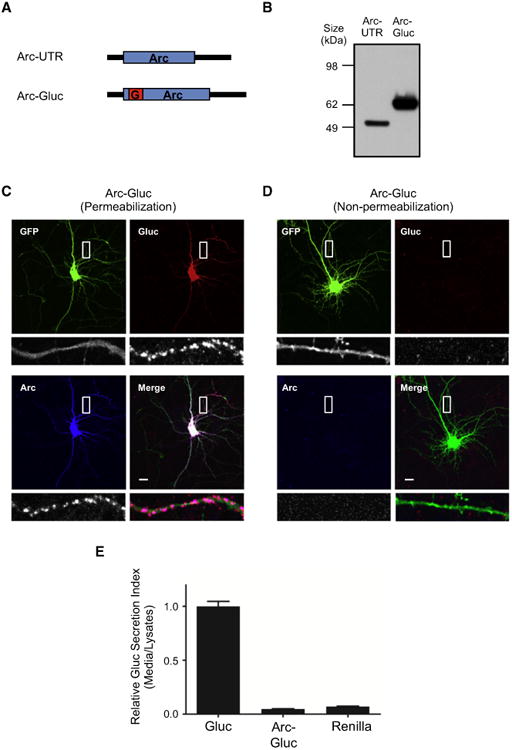
(A) Diagram of Arc-UTR and Arc-Gluc. Black bars,Arc UTR; blue box, Arc ORF; red box, Gaussia (Gluc)luciferase ORF.
(B) Arc-UTR and Arc-Gluc were transfected toHEK293T cells and lysates were blotted with Arcantibody.
(C and D) Immunocytochemistry of Arc-Gluc withEGFP. Bottom row shows the magnified picturesfrom the white square in the upper row. Scale bar,10 μm.
(C) Total staining after permeabilization.
(D) Surface staining without permeabilization.
(E) Relative secretion index of Gluc. Luciferaseactivity was measured from media and cell lysatesby spectrometry. Substrate, 40 μM coelenterazine(CTZ). Gluc, Gaussia luciferase; Renilla, Renillaluciferase (mean ± SEM, N = 4, 6, and 4, respectively).