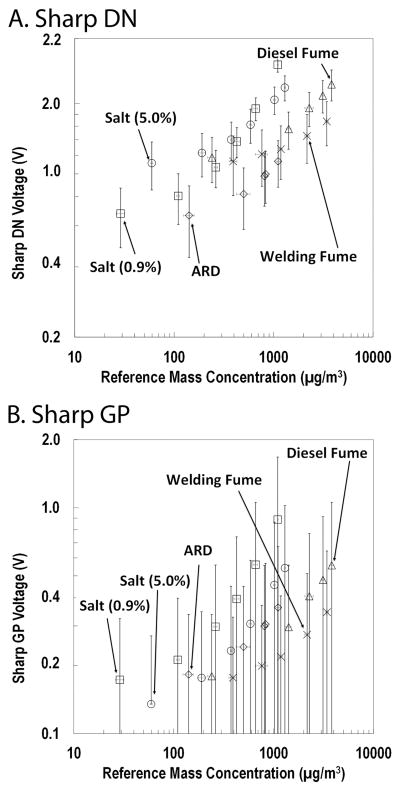
Figure 5.
Raw output of the low-cost sensors relative to reference mass concentration for: A) Sharp DN; B) Sharp GP. Reference mass concentration was calculated by correcting SMPS+APS data with mass concentration measured with a gravimetric filter for each aerosol. The error bars represent one standard deviation.

