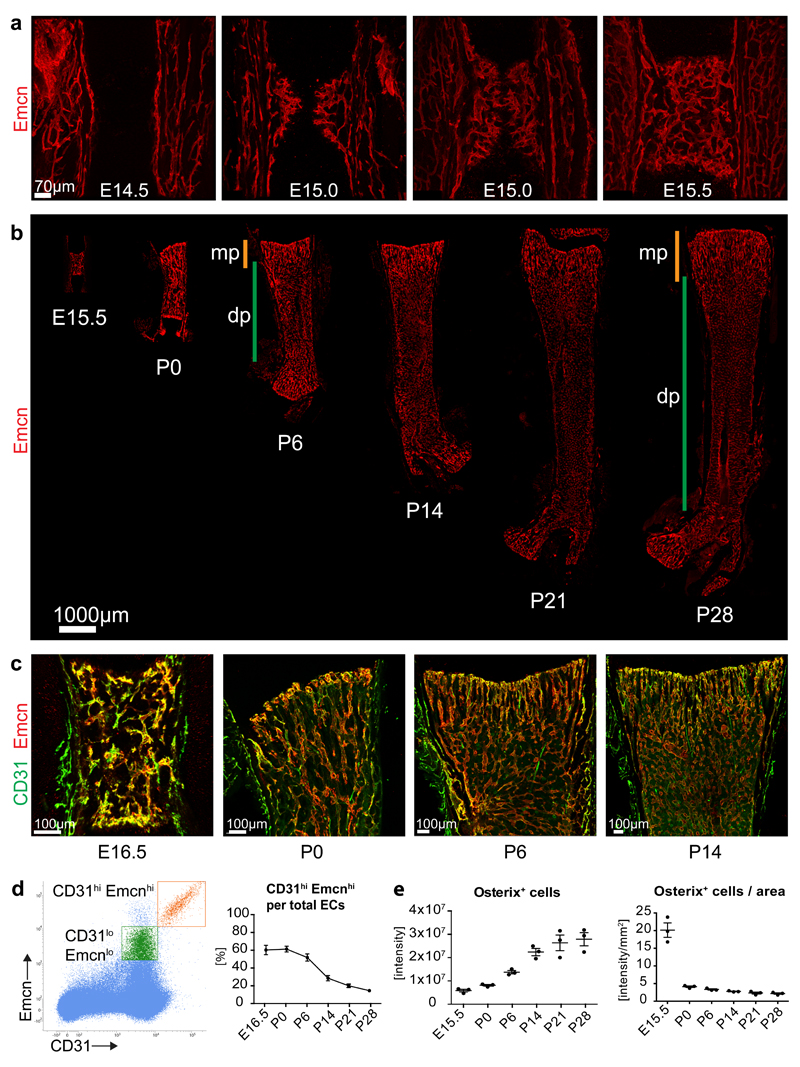
Figure 1. Developmental angiogenesis and EC subtypes in long bone.
a, Maximum intensity projections of confocal images showing Emcn-stained (red) ECs in E14.5, E15.0 and E15.5 femur. Note invading EC sprouts at E15.0 and establishment of a plexus at E15.5.
b, Confocal tile scans of Emcn-immunostained (red) E15.5, P0, P6, P14, P21 and P28 femur. Orange bars mark metaphysis (mp), green bars indicate diaphysis (dp).
c, Confocal images of CD31 (green) and Emcn (red) immunostained wild-type femur at the indicated stages. Note strong CD31 signal in ECs near postnatal growth plate and throughout the E16.5 vessel plexus.
d, Representative flow cytometry dot plot showing CD31hi Emcnhi (orange) and CD31lo Emcnlo ECs (green) in total bone marrow cells at P21. Gate settings exclude cells with very low Emcn expression (namely CD31+ hematopoietic cells and arterial ECs) from the analysis. Panel on the right shows the ratio of CD31hi Emcnhi among total (sum of CD31hi Emcnhi and CD31lo Emcnlo) ECs at the indicated developmental stages. Data represents mean± s.e.m. (n=3 individual experiments).
e, Quantitation of Osterix immunostaining signal intensity (artificial units) within the primary ossification centre, as measured in confocal tile scan images at given developmental stages (left). Graph on the right shows Osterix signal normalised to area of the primary ossification centre. Data represents mean± s.e.m. (n=3 individual mice per stage). Statistics source data are shown in Supplementary Table 6.

