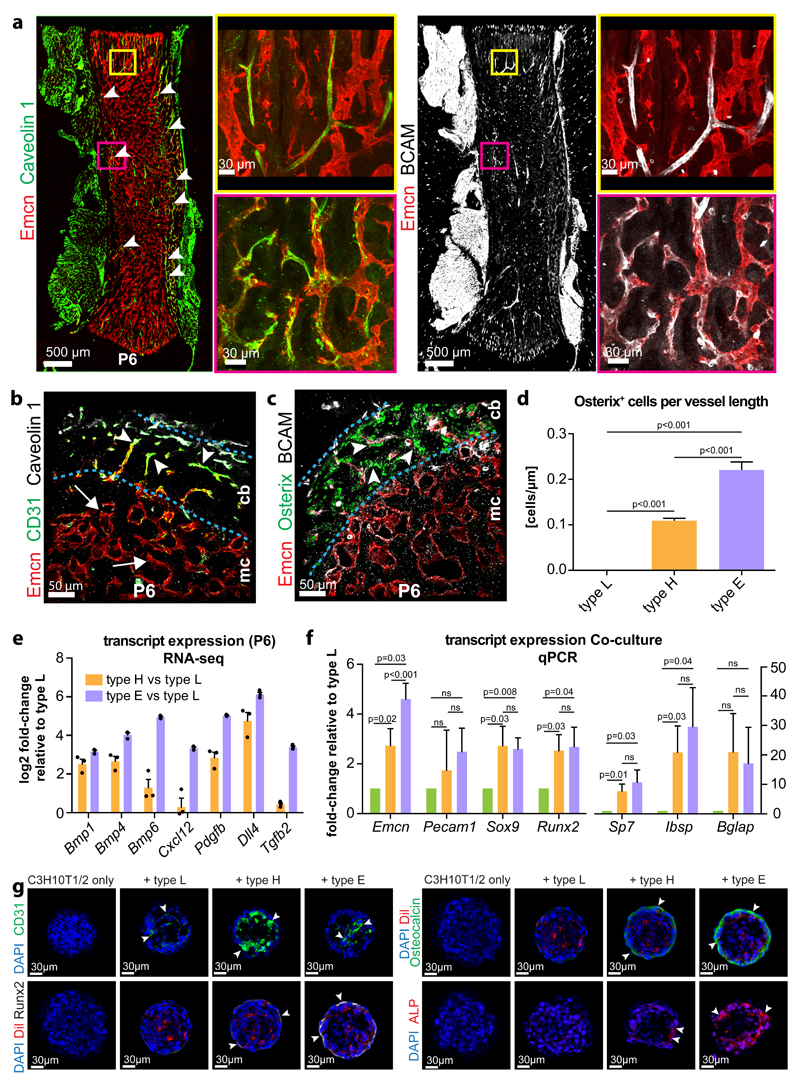
Figure 3. Characterization of EC subpopulations in developing long bone.
a, Immunostaining for Emcn (red) and the type E markers Caveolin 1 (green) and BCAM (white) in P6 femur. Panels on the right show higher magnification of corresponding insets.
b, c, Transverse sections through P6 femur showing CD31 (green) and Caveolin 1-positive (white) vessels in compact bone (cb) (arrowheads) (b). By contrast, the bone marrow cavity (mc) contains Emcn-positive vessels with low CD31 signal (arrow). BCAM-positive vessels (white) in compact bone were associated with Osterix-expressing osteoprogenitors (green) (c).
d, Quantitation of Osterix positive cells in proximity to type L vessels in the marrow cavity, metaphyseal type H vessels and to type E vessels in compact bone normalized to vessel length. Data represents mean± s.e.m. (n=6 mice), (p<0.001 between all compared groups, two-tailed unpaired t-test).
e, RNA-seq-based expression levels of the indicated transcripts relative to expression in type L in freshly isolated P6 EC subpopulations. Data based on RPKM values obtained from RNA-seq. Data represents mean± s.e.m. (n=3 independent experiments). Statistics source data are shown in Supplementary Table 6.
f, Transcript expression in EC-C3H10T1/2 spheroid co-cultures (at day 7). Transcripts encoding Sox9, Runx2, Osteopontin (Sp7), integrin binding sialoprotein (Ibsp), and Osteocalcin (Bglap) were upregulated in cultures containing primary type H or type E ECs. Data represents mean± s.e.m. (n=7 independent experiments), two-tailed unpaired t-test.
g, Immunostaining of EC-C3H10T1/2 spheroids after 7 days in culture. Signals for Runx2 (white), Osteocalcin (green) and Alkaline phosphatase (red) were upregulated by CD31hi (green) type H and type E ECs (arrowheads) but not in the presence of type L ECs. Nuclei, DAPI (blue). ECs were pre-labeled by DiI (red) at the onset of the experiments.

