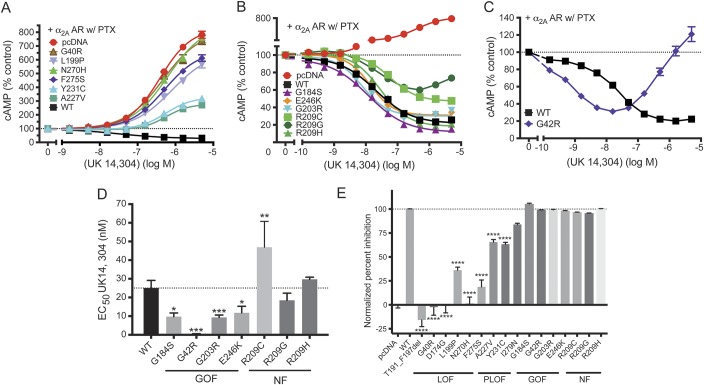
Figure 2. Effect on α2A adrenergic receptor (α2A AR)–mediated cyclic adenosine monophosphate (cAMP) inhibition by GNAO1 mutants.
(A–C) Dose–response curves of representative GNAO1 mutants. (A) Dose–response curves of loss-of-function (LOF) and partial loss-of-function (PLOF) mutants (G40R, L199P, N270H, F275S, A227V, Y231C) show changes in cAMP production in response to the adenylate cyclase activator forskolin and α2 AR agonist UK14,304, compared to the positive control (wild-type [WT]) and negative control (pcDNA). (B) Dose–response curves of functioning Gαo mutants show changes in cAMP production in response to the α2 AR agonist UK14,304. All dose–response curves are shown in comparison with WT and G184S. (C) G42R displays a biphasic dose–response curve with cAMP inhibition at low concentrations (gain of function [GOF]), followed by enhancement of cAMP levels at higher concentrations of UK14,304. (D) Quantification of EC50 of functioning Gαo mutants. G42R, G203R, and E246K exhibit significantly increased potency for α2A AR–mediated cAMP inhibition similar to the known GOF mutation G184S. *p < 0.05, **p < 0.01, ***p < 0.001 using paired t test between WT and each mutant separately (figure e-4). (E) Percentage of maximum inhibition (n = 5) was normalized to pcDNA (0%; resulting in activation of cAMP) and WT (100%). ****p < 0.0001 using 1-way analysis of variance with Bonferroni post hoc test for pairwise comparison. Note that the maximum inhibition of G42R was calculated at UK14,304 of 15.8 nM. NF = normal function; PTX = pertussis toxin.

