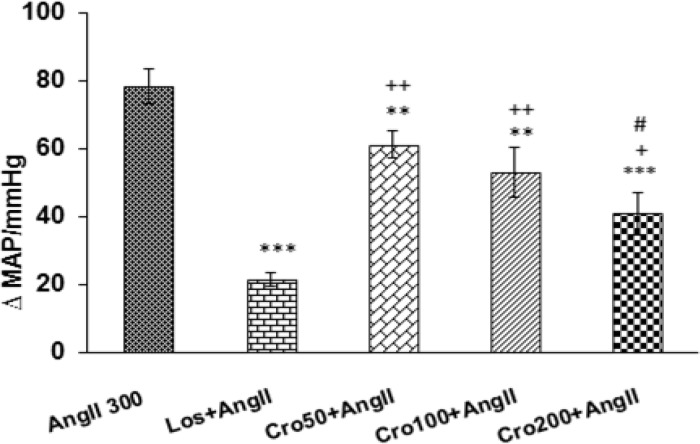
Figure 2.
Maximal changes of systolic blood pressure (SBP) (A), mean arterial pressure (MAP) (B), and heart rate (HR) (C) in response to infusion of angiotensin II (Ang II 300 ng/kg) and Ang II+ Losartan (Los; 10 mg/kg). Data are expressed as mean ± SEM (n= 6 in each group). One way ANOVA with post hoc test used for statistical analysis. *** p<0.001 compared to control group, +++ p<0.001 compared to Ang II 300 group and # p<0.05 and ## p<0.01 compared to control group

