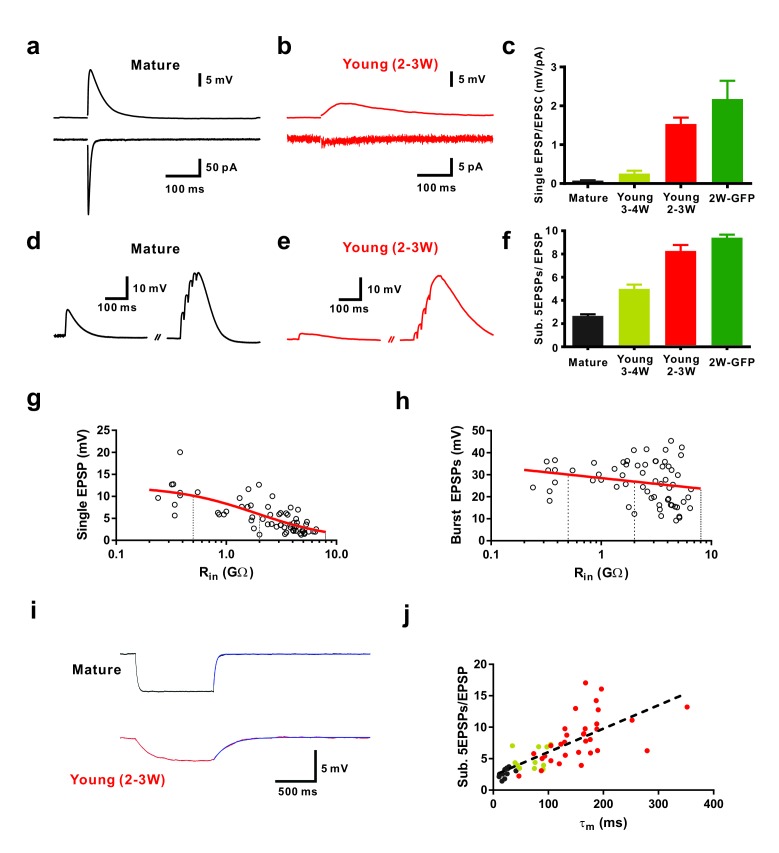
Figure 1. Efficient subthreshold EPSP summation in newborn young granule cells.
(a, b) Example of synaptic EPSPs (top) and corresponding EPSCs (bottom) in a mature (a) and in a DCX-DsRed expressing young granule cell with an estimated age of 2.5 weeks post mitosis (b), recorded at resting membrane potential (Vm = −80 mV). Extracellular stimulation intensity was 30 µA with 0.2 ms duration. (c) The ratio of synaptic EPSP relative to EPSC amplitude in individual cells is significantly higher in 2 wpi GFP labelled neurons (2W-GFP, p<0.001) and 2–3 week old DCX-DsRed labelled neurons (young 2–3W) relative to mature granule cells (p<0.0001, Mann-Whitney). The EPSP/EPSC ratio in 2W-GFP and young 2–3 W cells was not significantly different (p=0.282, Mann-Whitney). Bars for mature, 3–4W-DsRed, 2–3W-DsRed and 2W-GFP cells represent data from n = 19, 12, 8 and 6 neurons, respectively. (d, e) Subthreshold summation of five EPSPs evoked by brief burst stimuli (5@50 Hz, 20 µA) in a mature (d) and a young 2.5 week old GC (e). (f) The ratio of burst EPSP amplitude to single EPSPs is significantly higher in 2W-GFP (p<0.0001, Mann-Whitney) and young 2–3 week old neurons (p<0.0001, Mann-Whitney) relative to mature cells. Bars for mature, 3–4W young, 2–3W young and 2W-GFP cells represent data from n = 20, 33, 51 and 11 neurons, respectively. Stimulation intensity: 10–20 µA. (g, h) Amplitude of single EPSPs (g) and burst EPSPs (h, 5@50 Hz, 20 µA) in young and mature GCs were plotted against Rin (n = 63). Single EPSPs (g) were fitted with a sigmoidal function, showing a half-maximal amplitude with Rin = 1.9 GΩ. Burst EPSPs (h) were fitted with linear regression analysis revealing a small but non-significant decrease with Rin (p=0.08). The vertical dashed lines indicate the Rin at 4, 3 and 2 weeks post mitosis. (i) Examples of membrane potential hyperpolarization (~5 mV) by small negative current pulses in a mature (top) and young 2.5 week old GC (bottom). The blue curve represents a mono-exponential fit to the repolarization phase for estimation of the membrane time constant (τm). (j) The ratio of burst EPSP amplitude to single EPSPs significantly correlates with the membrane time constant of young and mature GCs. Dashed line represents a linear regression, showing that the slope is significantly non-zero (p<0.0001, n = 55). The dots in black, yellow and red are data points from mature, 3–4 week old DsRed and 2–3 week old DsRed cells, respectively.


