
Fig. 4. LW measurements.
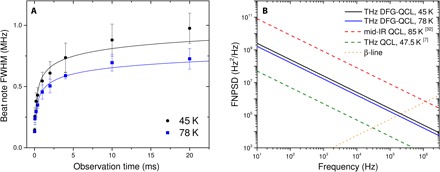
(A) Width of the beat note at different time scales measured at two different operating temperatures of the device. The use of an FFT spectrum analyzer allows retrieval of the beat note spectra over different integration times and therefore evaluation of the THz DFG-QCL emission LW at different time scales (ranging from 20 μs to approximately 20 ms). Solid lines are fits with a logarithmic function. The logarithmic dependence of the LW on time confirms the 1/f nature of the QCL frequency noise (see Methods for details). (B) Reconstruction of the FNPSD of the THz DFG-QCL emission. The plots have been obtained by inverting the approach developed by Di Domenico et al. 36, as discussed in Methods. This procedure allows retrieving the FNPSD for frequencies where it is larger than the β-line [8/π2ln(2)f, dotted in the lower part of the graph. Given the smallest time scale of 20 μs of our setup, our measurements do not include frequencies higher than 50 kHz. The dashed red and green lines refer to the measurements performed by Bartalini et al. (34) and Vitiello et al. (7) for the mid-IR and THz QCLs, respectively, whereas the solid lines refer to the measurements presented in this work.