
Fig. 6. Cosedimentation analysis of the CL-dependent association of Tim50IMS with lipid bilayers.
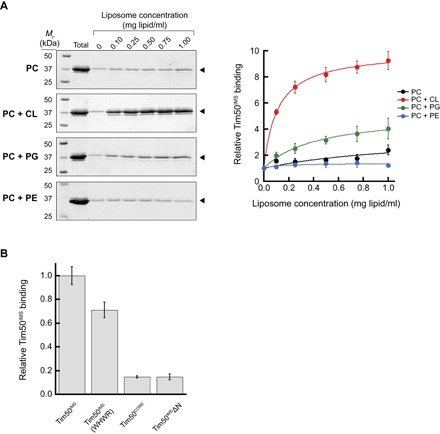
(A) Liposome cosedimentation analysis of Tim50IMS. Left: SDS-PAGE/SYPRO Orange stain profiles of Tim50IMS (1 μM) cosedimented with sucrose-loaded LUVs of defined lipid composition and increasing lipid concentration (up to 1.0 mg lipid/ml). Lipid compositions include PC (100 mol % POPC), PC + CL (80 mol % POPC and 20 mol % TOCL), PC + PG (80 mol % POPC and 20 mol % POPG), and PC + PE (50 mol % POPC and 50 mol % POPE). Bands used for quantitation are shown by the closed arrowheads. Right: Quantitation of relative Tim50IMS liposome cosedimentation for each lipid composition. Means represent values from three independent experiments (normalized with respect to band intensity in the absence of added liposomes); error bars represent SDs. (B) Cosedimentation analysis of Tim50IMS variants. Cosedimentation experiments conducted as above for 1 μM Tim50IMS, Tim50IMS W207A H211A W213A R214A (Tim50IMS WHWR), Tim50CORE (residues 165 to 361), and Tim50IMSΔN (residues 165 to 476) in the presence of PC + CL LUVs (final concentration, 0.5 mg lipid/ml). Means are normalized relative to Tim50IMS binding for three independent experiments; error bars represent SDs.