
Fig. 7. Analysis of CL-mediated changes in Tim50IMS proteolysis, labeling, and bilayer exposure.
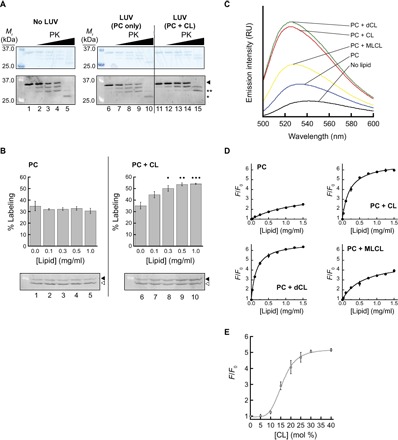
(A) Limited proteolysis of Tim50IMS. Tim50IMS (1 μM) was preincubated without lipid vesicles (lanes 1 to 5) or with vesicles composed of POPC only (“PC”; lanes 6 to 10) or POPC with 20 mol % TOCL (“PC + CL”; lanes 11 to 15). Samples were incubated in the absence of protease (lanes 1, 6, and 11) or in the presence of increasing proteinase K (“PK”; 0.67 nM, lanes 2, 7, and 12; 2.0 nM, lanes 3, 8, and 13; 5.0 nM, lanes 4, 9, and 14; 100 nM, lanes 5, 10, and 15) and resolved by SDS-PAGE. Intact Tim50IMS is indicated by the arrowhead, the smallest product detected with Tim50IMS alone or with POPC vesicles is indicated by “*,” and the predominant band protected in the presence of POPC + TOCL vesicles is indicated by “**.” (B) Lipid-dependent cysteine accessibility of Tim50IMS. Tim50IMS (1 μM) was incubated in the presence of vesicles composed of POPC only (“PC”) or POPC with 20 mol % TOCL (“PC + CL”) at the indicated lipid concentrations and subjected to labeling with the thiol-reactive reagent TMM(PEG)12. Representative gels (below) show unlabeled (open arrowhead) and labeled (closed arrowhead) Tim50IMS. Quantification of the labeling efficiency (percent labeled relative to total labeled and unlabeled; means of three independent samples with SDs) is shown for each lipid concentration in plots above. Dots indicate significant differences in labeling compared to results from control (no liposomes) by Student’s t test (•P < 0.05; ••P < 0.01; •••P < 0.0001). (C) Fluorescence-detected interaction between Tim50IMS and lipid bilayers. NBD-Tim50IMS(S208C) (500 nM) was incubated in the absence of lipid vesicles or in the presence of liposomes (1 mg lipid/ml) with differing lipid composition [POPC only (“PC”) or POPC with 20 mol % TOCL (“PC + CL”), dCL (“PC + dCL”), or MLCL (“PC + MLCL”), as indicated] and samples were subjected to fluorescence emission scans. (D) Tim50IMS-bilayer interactions with different CL variants. NBD-Tim50IMS(S208C) was incubated with varying concentrations of vesicles containing the indicated lipid compositions [described in (C)] and used for spectral analysis. The extent of interaction is reported as the fractional increase in emission intensity at the λmax (F/F0). (E) Tim50IMS-bilayer interaction with increasing TOCL concentration. NBD-Tim50IMS(S208C) was incubated with liposomes containing up to 40 mol % TOCL, and the fractional increase in emission intensity was measured.