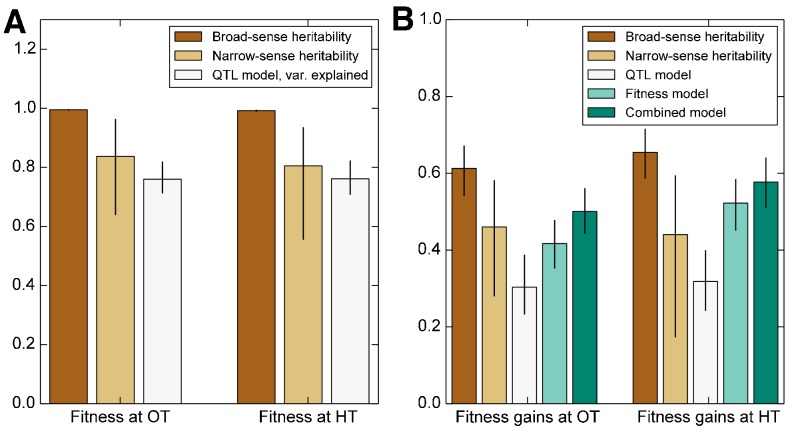
Figure 2. Heritability of fitness and adaptability.
Tan bars denote broad-sense and narrow sense heritability of (A) founder fitness and (B) fitness gain after evolution in the indicated environment (i.e. adaptability). White bars denote the heritability explained by a linear model based on the QTLs identified as affecting initial fitness or adaptability (Materials and methods). Green bars indicate the heritability of adaptability explained by initial fitness in that condition. Error bars indicate 95% confidence intervals.

