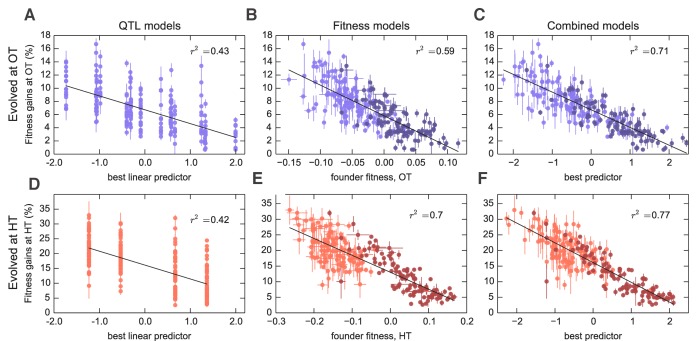
Figure 3. Models to predict adaptability.
Each point represents the average fitness change of four populations descended from the same founder after 500 generations of evolution in the (A–C) OT environment or (D–F) HT environment. Error bars denote s.e.m. Lines show the predictions of different models; indicates the fraction of the variance explained, which is similar to the fraction of the broad-sense heritability explained by the model. (A,D) Linear QTL model, where the -axis is the linear combination of identified QTLs that best predicts the fitness gains in each environment. (B,E) Model where founder fitness is used as predictor for fitness gain. (C,F) Combined model, where the -axis is the linear combination of initial fitness and the identified QTLs that best predicts the fitness gains in each environment. Dark and light shades represent BY and RM alleles at the KRE33 locus respectively. For model parameters, see Figure 3—source data 1.

