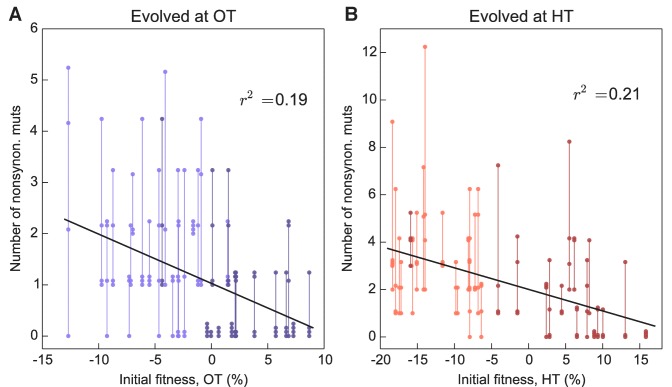
Figure 5. Number of fixed nonsynonymous mutations.
Each point represents the number of fixed nonsynonymous mutations in a population evolved at (A) OT or (B) HT. Populations descended from the same founder are connected by vertical lines for visual convenience, with founders ordered according to their fitness in the corresponding environment. Dark and light shades represent BY and RM alleles at the KRE33 locus respectively.

