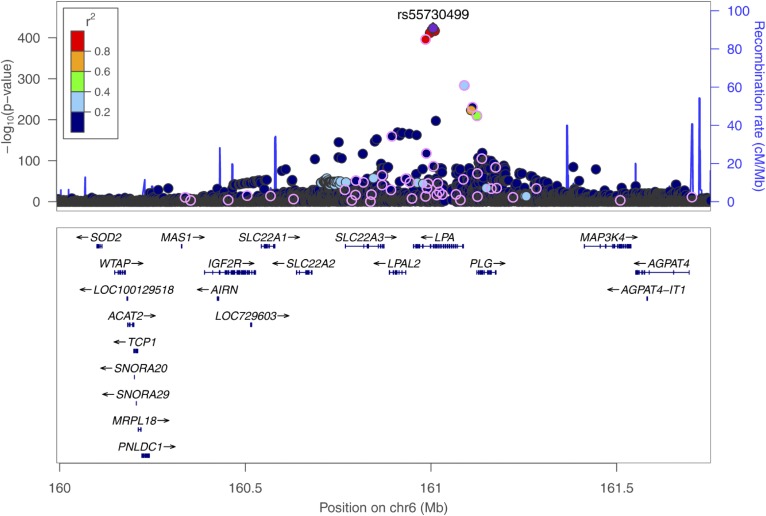
Fig. 1.
Regional plot showing the genomic region around the LPA gene (chr6:159,991,850-161,753,083; LD refers to rs55730499, based on 1000G EUR); P values are derived from the meta-analysis on the five cohorts including 13,781 individuals on inverse-normal transformed Lp(a) concentrations, adjusted for age and sex. All 48 SNPs, which are independently associated with Lp(a) in a joint model, are circled.

