


Fig. 3. Assessing the DNA binding activity of MatA and MatB.
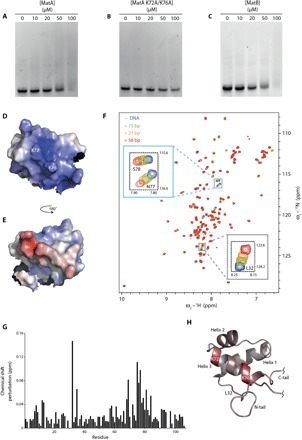
(A) EMSA experiments show that adding an increasing concentration of MatA to a dsDNA oligonucleotide causes the free DNA band to be progressively replaced by a broad smear, indicating (nonspecific) binding (see text). (B) Mutating residues Lys72 and Lys76 to Ala abolishes this interaction, implicating these residues in the mechanism of DNA binding. (C) Addition of MatB causes a similar pattern to that seen for the addition of MatA. (D and E) Electrostatic potential surface of MatA, omitting the tail regions for clarity. The orientation shown in (D) (same as in Fig. 1A) shows the pronounced basic patch resulting from the conserved basic residues on the surface of helix 3. (F) Adding various lengths of dsDNA to samples of 15N-labeled MatA causes peaks to shift in the 15N-1H HSQC (heteronuclear single-quantum coherence) NMR spectrum; these CSPs can be plotted as a histogram (G) and mapped as a color ramp onto the lowest energy structure of MatA (H), shown in the same orientation as (D). This shows that many of the shifts map to the third helix, again implicating this region in direct interactions with the DNA; Leu32, which is N-terminal to the core folded domain, is also strongly affected. The NMR experiments used MatA (20 μM) and DNA (80 μM) in 25 mM phosphate (pH 6), 50 mM NaCl, and 50 μM EDTA. ppm, parts per million.