Figure 3.
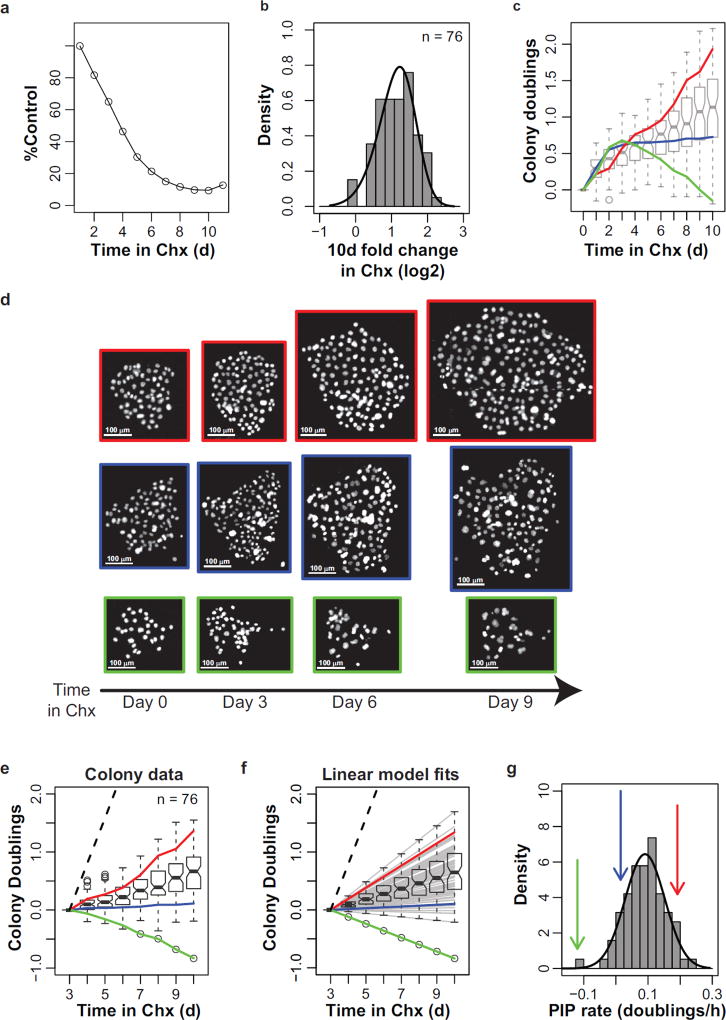
Perturbation-induced proliferation (PIP) rates capture clonal fitness. (a) Cycloheximide (Chx, 500 ng/ml) reduces PC9 proliferation relative to control. Each data point represents the average number of cycloheximide-treated cells relative to control (n = 4 wells from a cFP experiment). (b) Histogram of the per-colony relative log2 fold change in cell number after 10 days of cycloheximide treatment. Curve represents the best fit using a skew-normal distribution. (c) Cycloheximide-induced colony dynamics. Colony doublings represents the log2-transformed cell number per colony normalized to the initial size of that colony. Boxplots show the interquartile range of cycloheximide-treated colony doublings at each time point. Colored lines display the dynamics of three representative colonies in d. (d) Images of H2B-mRFP labeled cell nuclei for the representative colonies in c. Scale bars = 100 µm (e) Colony dynamics, same as in c, except colonies are normalized to the colony size after 3 days of treatment. Lines and boxplots are the same as in c. (f) Linear model fits of colony dynamics simplify the colony doublings data. The linear model fit of each colony response from 3 days on is shown as a gray line. The estimated linear model fits of the representative colonies from c are shown as colored lines, as previously described. Boxplots represent the interquartile range of the expected values for colony doublings at each time point.

