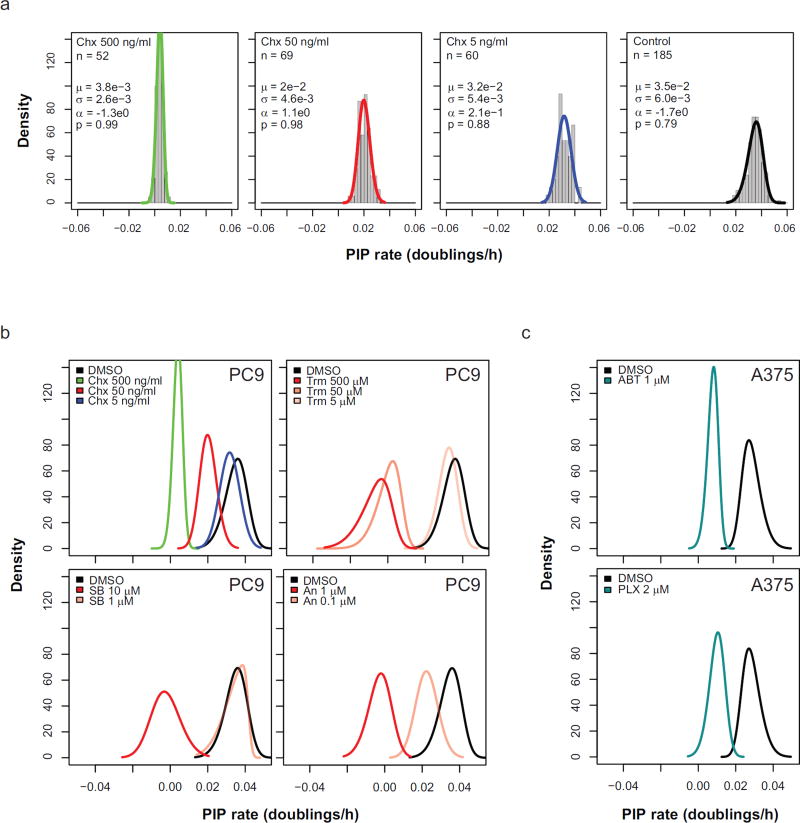
Figure 4.
Measuring the clonal structure in response to perturbations. (a) Concentration dependent effects of cycloheximide treatment. Histograms of PIP rates are shown for PC9 colonies at decreasing concentrations (left to right). Curves represent the estimated skew-normal probability distribution with the indicated values. Kolmogorov-Smirnov test p-values are shown. High p-value indicates there is insufficient evidence to reject the fit (b). Upper-left, The skew-normal fits (same color) from a are superimposed to illustrate the concentration-dependent effects of cycloheximide without the data. Concentration dependent effects are similarly shown for trametinib (Trm), SB203580 (SB), and anisomycin (An). (c) Skew normal fits are displayed for A375 cells treated with either ABT-737 (ABT) or PLX4720 (PLX).

