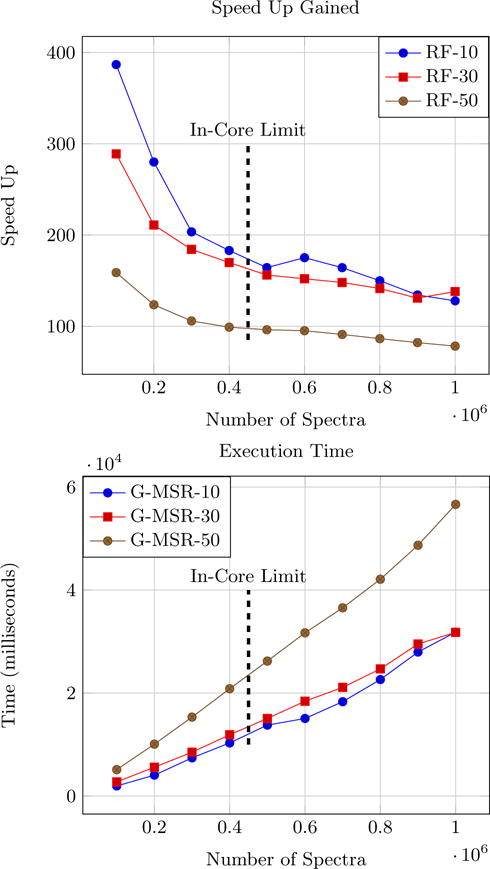
Figure 5.

Top figure shows the speed up achieved by G-MSR over MS-REDUCE and the bottom figure shows the execution times for G-MSR operating at reduction factors of 10, 30 and 50. The vertical line represents the point where in-core memory is filled.
