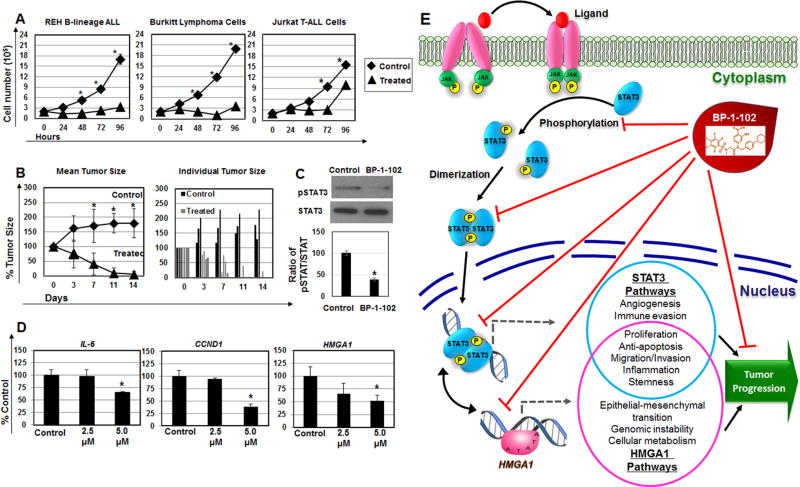
Figure 1. BP-1-102 inhibits proliferation, tumor growth, STAT3 phosphorylation, STAT3 transcriptional targets, and HMGA1 gene expression in REH B-lineage ALL cells.
(A) BP-1-102 arrests cell proliferation in REH B-ALL, Burktte (Ramos) and Jurkat T-ALL cells grown in vitro. Cells were cultured for 96 hours in the presence of 5 uM BP-1-102. Cell number was assessed every 24 hours. Note that this concentration (5 µM) is readily achieved in plasma of murine models after oral administration. (* denotes P <0.05; student’s t-test).
(B) Mice bearing REH tumors were treated orally by gavage with 3.0 mg/kg of inhibitor dissolved in dimethyl sulfoxide (DMSO; 100 mg/mL) as vehicle daily for 14 days; the control arm received the same volume of vehicle alone by gavage daily. Tumor sizes were measured every 2–3 days. All treated mice responded, and three tumors disappeared. Tumors were 100–200 mm3 at the start of treatment, and considered 100%. The difference between the control and inhibitor treatment arms was significant by day 7 and remained statistically significant throughout the remainder of the treatment as assessed by student’s t-test (P = 0.04 on day 7; P = 0.004 on day 11; P = 0.02 on day 14). The bar graph shows individual tumors. As above, tumors were assigned a value of 100% at the start of therapy. As shown, 3 treated tumors completely disappeared, and 2 regressed dramatically. (* denotes P <0.05).
(C) Western blot shows a decrease in relative pSTAT:STAT3 in REH cells treated with BP-102 at 5.0 µM at 6 hours. The bar graph shows densitometry of the ratio of pSTAT3/STAT3 from control cells (assigned a value of 100%) compared to BP-1-102 treated cells (100% ± 5.4% for controla arm versus 38.7% ± 3.2% for BR-1-102 treatment arm; P < 0.001 by student’s t-test).
(D) The STAT3 transcriptional target genes, CCND1 and IL-6, are repressed in REH B-ALL cells following 6 hours of treatment with BP-1-102. HMGA1 is also repressed in REH B-ALL cells treated with BP-1-102 (at 6 hours). Gene expression was normalized to the PO gene. (*P <0.05 by student’s t-test).
(E) Model for BP-1-102 anti-tumor activity: BP-1-102 blocks STAT3 phosphorylation, dimerization, localization to the nucleus, and activation of STAT3 tumor promoting pathways, including HMGA1. HMGA1 also induces the STAT3 gene, and other tumor progression pathways [6].

