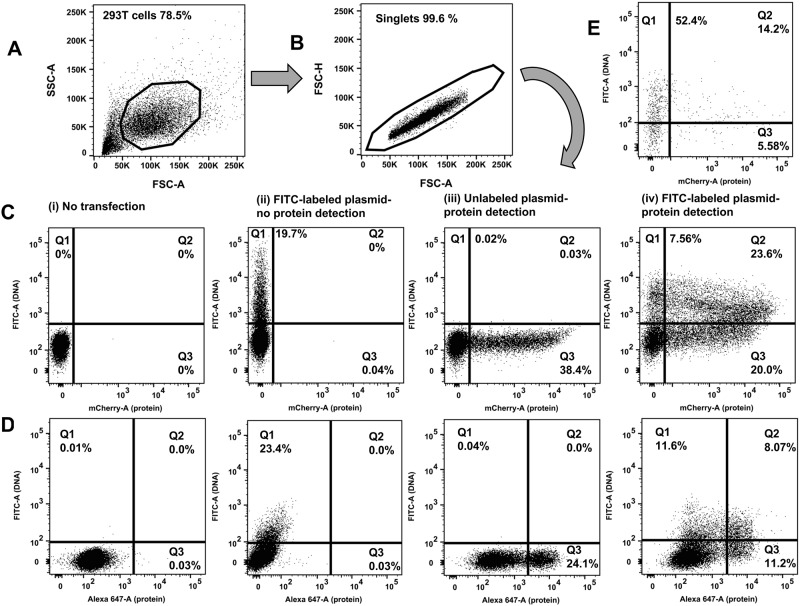
Fig 1. Flow cytometric determination of transfection efficiency based on two independent readouts (DNA plasmid uptake and protein expression).
Representative transfections are shown. 293T cells underwent chemical transfection using the TransITX2 transfection reagent as described in Methods. The same amount (1 μg) of DNA was used for two independent plasmids: a small (B: pUltraHot expressing mCherry, 8.3 kb) and a large (C: pNL4-3 expressing p24, 14.0 kb) DNA plasmid. Gating strategy is shown: A) forward and side scatter B) discrimination of doublets C, D) two independent readouts of transfection efficiency. FITC fluorescence corresponds to the uptake of FITC-labeled plasmid DNA (y-axis). A fluorochrome that has no spectral overlap with FITC is used to quantify protein expression. Either a fluorescent protein can be used (e.g. mCherry; shown in C) or a protein labeled with a fluorescent-labeled antibody (e.g. intracellular expression of HIV-1 p24 protein was detected by an CF647-labeled anti-p24 antibody; shown in D). Co-expression of DNA taken up by cells and target protein were analyzed 24 h after transfection. The numbers in the quadrants indicate the percentages of viable cells that took up the FITC labeled DNA plasmid versus the expressed protein that was detected. The following dot plots are shown for each chemical transfection in 293T cells: i) untransfected cells (negative control), ii) cells transfected with FITC-labeled DNA plasmid harvested before protein expression occurred (3 hours post transfection), iii) cells transfected with unlabeled plasmid harvested 24 hours after transfection (when protein expression can be quantified) iv) cells transfected with FITC-labeled DNA plasmid and harvested 24 hours after transfection (when protein expression can be quantified). In this plot Q3 quadrant demonstrates many cells that express protein but do not show any fluorescence associated with uptake of the plasmid DNA. This may reflect effects of the cellular machinery on FITC fluorescence (see Discussion). Either Q1+Q2 (DNA signal) or Q2+Q3 (protein signal) should be used as readouts of transfection efficiency. E. Transfection efficiency was quantified in human lymphocytes (Jurkat E6 cells) harvested 24 hours after electroporation with FITC-labeled DNA mCherry plasmid without the need to use co-transfection of 2 different plasmids and GFP reporter.

