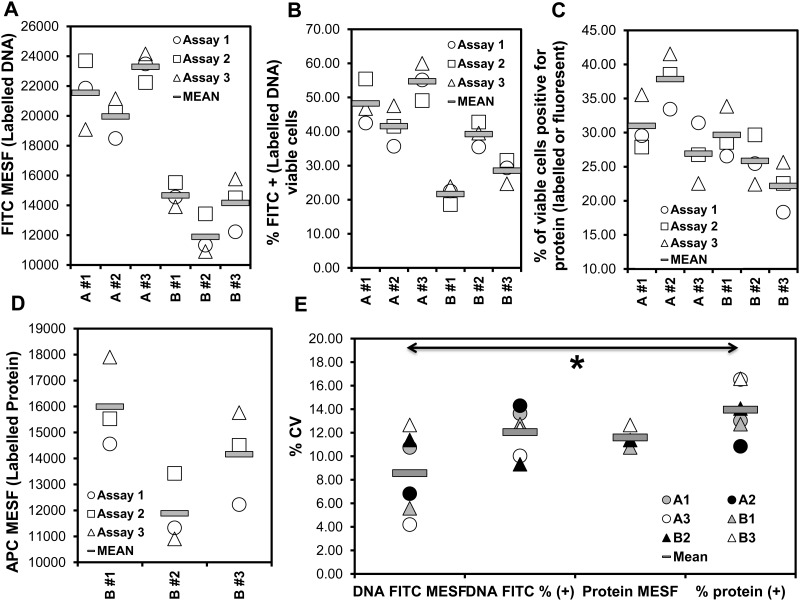
Fig 5. Standardization and reproducibility of described flow cytometric method that quantifies transfection efficiency.
Three different stocks of 293T cells (1–3,<20 passages) underwent chemical transfection using the TransITX2 transfection reagent and the mCherry plasmid (plasmid A) and the NL4.3 plasmid (plasmid B) as described in Fig 1. Co-expression of DNA taken up by cells and target protein were analyzed 24 h after transfection. MESF (Molecules of Equivalent Soluble Fluorochrome) beads were used to standardize median fluorescence intensity (MFI) units as described in Methods. The four measures of transfection efficiency [A: MESF of FITC (labeled DNA) in viable cells, B: % FITC+ (labeled DNA) of viable cells, C: % viable cells positive for protein (labelled or fluorescent), D: MESF of fluorochrome used to label protein (APC in this case) in viable cells] are means of triplicates from three independent experiments (Assay 1–3) and are plotted in A-D. Note that MESF beads are not available for mCherry and in this case the MFI can be used to quantify levels of expression of protein per cell. The comparison of the coefficient of variation (CV%) among the 4 independent readouts is shown in E. The mean inter-assay variability for these six samples (A1-3, B1-3) for the different readouts (A-D) was as follows: A: 8.56% (range 4.19 to 12.66%), B: 12.06% (range 9.32 to 14.30%), C: 11.59% (range 10.75 to 12.66%), D: 13.96% (range 10.84 to 16.59%). The readout A was more reproducible (p<0.05, ANOVA). Similar standardization can be established with various cells and transfection methods (e.g. Jurkat E6 cells electroporation with FITC-labeled DNA mCherry plasmid).

