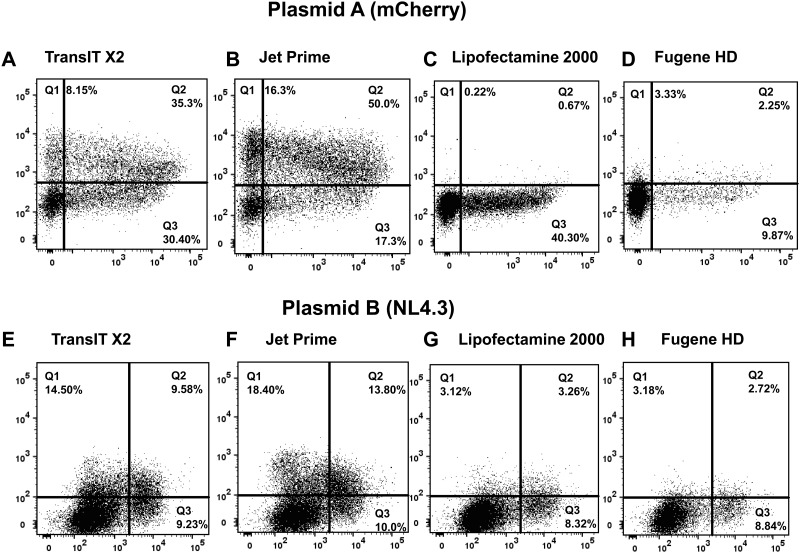
Fig 7. Comparison of major commercially available transfection reagents using described flow cytometric method that quantifies transfection efficiency.
293T cells underwent chemical transfection using different commercially available transfection reagents and the mCherry plasmid (plasmid A; A, B, C, D) or the NL4.3 plasmid (plasmid B; E, F, G, H) as described in Fig 1. Co-expression of DNA taken up by cells and target protein were analyzed at 24 hours after transfection. Data are means of triplicates from three independent experiments. For each reagent the ratio of transfection reagent to DNA amount was optimized as per manufacturer`s instructions and the same (1 μg) amount of DNA was used.

