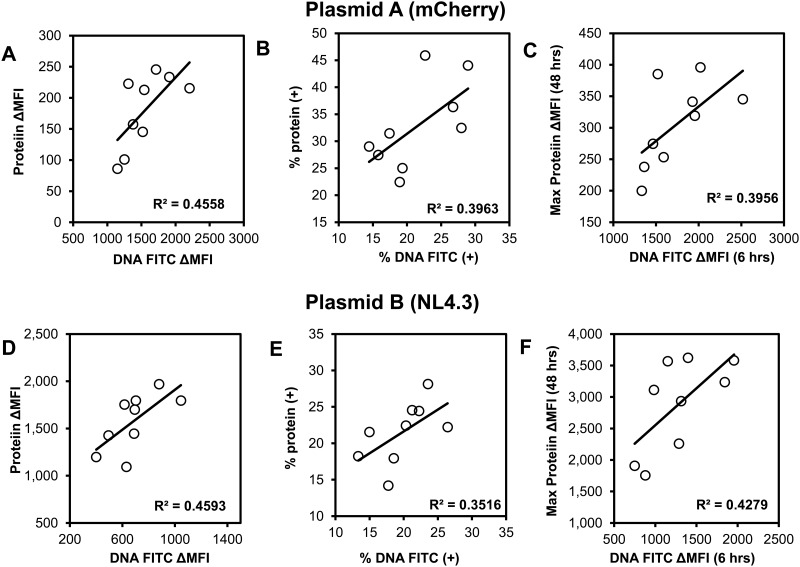
Fig 9. Correlations between readouts of described flow cytometric method that quantifies transfection efficiency.
293T cells (<20 passages) underwent chemical transfection using the TransITX2 transfection reagent and the mCherry plasmid (plasmid A, A-C) or the NL4.3 plasmid (plasmid B, D-F) as described in Fig 1. Co-expression of DNA taken up by cells and target protein were analyzed at 6 (C,F), 24 (A,B, D, E) and 48 (C, F) h after transfection. Median fluorescence intensity was subtracted from the respective untransfected control (ΔMFI) as described in Methods. Spearman correlations between the same readouts (% positive of viable cells vs ΔMFI in viable cells) are shown for labeled DNA vs labeled protein for the two different plasmids. Overall, ΔMFIs correlated better than % positivity of viable cells (all p values≤0.05). In addition an early (6 hours) readout from labeled DNA (FITC) correlated significantly with the maximum (48 hours) ΔMFI that corresponded to expression of protein per cell (C, F).

