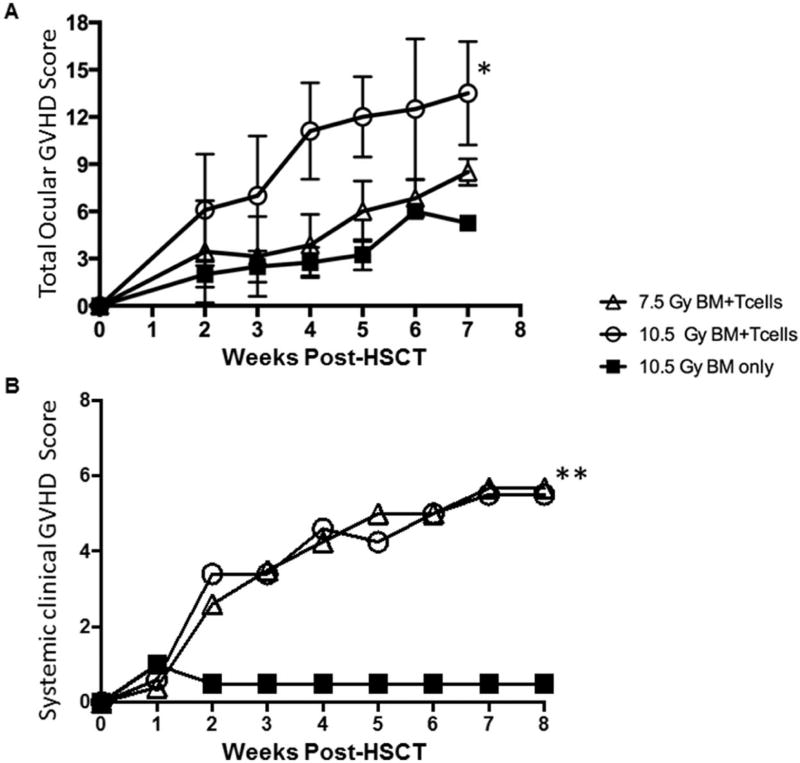
Fig 5. Total ocular GVHD score identifies differences between animals expressing comparable systemic GVHD changes.
Animals as described in Figs. 3 and 4 were assessed for both overall systemic GVHD clinical changes and total ocular GVHD scoring. A) Total ocular GVHD score, combining clinical and eGFP scores for both anatomic domains, reflect overall ocular GVHD progression and illustrate significant differences between low and high conditioned groups. B) Total systemic GVHD score for all groups of conditioned mice did not identify differences between low and high conditioned animals. Mean values are mean score +/− SEM of data from all mice in the injected T cell or control groups. *p < .05. **p < .0.01, paired t-test

