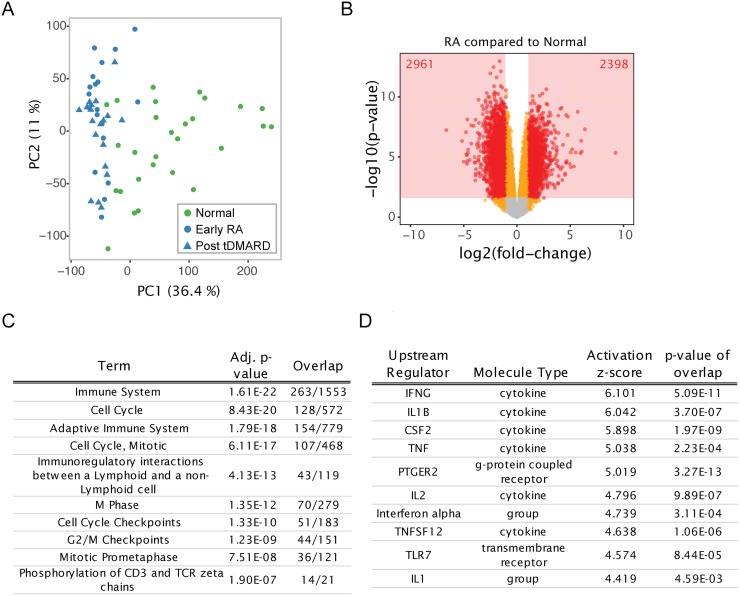
Fig 1. Large transcriptional differences separate RA synovial biopsies from healthy samples.
(A) PCA demonstrates variability of normal synovial biopsy samples and clustering of RA samples together. Sample scores are plotted for the first two principal components (the percent variance explained is given for each PC). Samples are colored by disease type; shape indicates visit for RA subjects. PCA was performed with all gene expression features used in this analysis. (B) Volcano plot depicting the log(fold-changes) and p-values for the comparison of all baseline RA samples to all normal samples. The number of gene features satisfying the statistical significance cutoff are given. (C) Top ten pathway terms (Reactome database) and (D) top ten predicted upstream regulators (IPA database) are shown from the comparison of baseline RA samples to normal samples.

