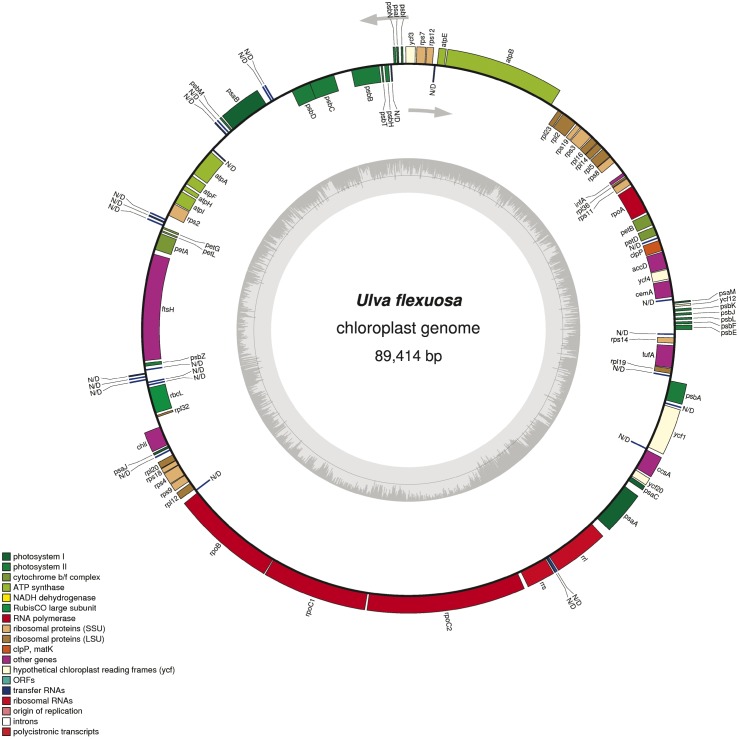
Fig 4. Schematic representation of the U. flexuosa chloroplast genome using OGDRAW.
The predicted genes are shown and colors represent functional classifications, which are shown at the left bottom. The genes drawn outside the circle are transcribed counterclockwise. The inner circle shows the GC content. IR regions are not found according to Gepard-1.40 analysis.

