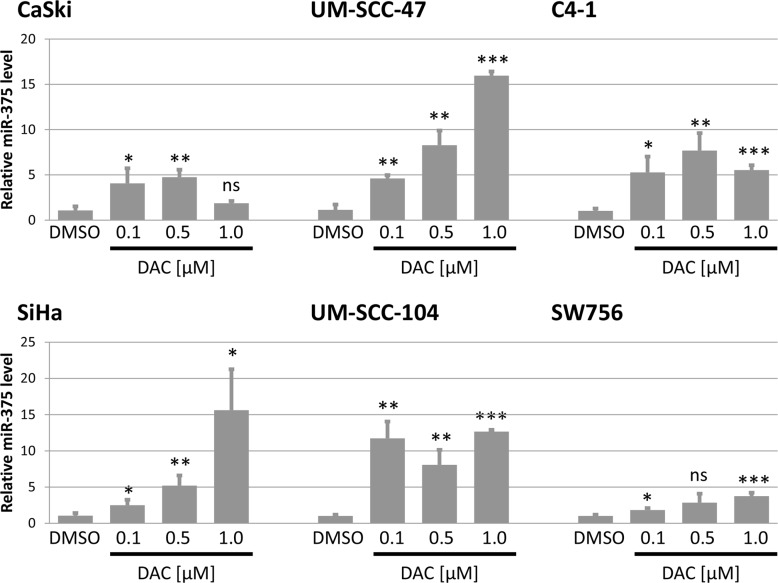
Figure 5. Expression of miR-375 is reactivated after treatment with DAC in all tested cell lines.
Quantification of miR-375 in DAC treated cell lines was performed using TaqMan qPCR assays. miR-375 levels were calculated relative to the solvent DMSO (mock) and snRNA U6 was used as internal loading control. Data are shown as mean miR-375 levels from at least three independent experiments and the error bars reflect the according standard deviation. Student`s t-test was performed to calculate p values by using DMSO as a reference control. *p < 0.05, **p < 0.01, ***p < 0.001 and ns: not significant.

