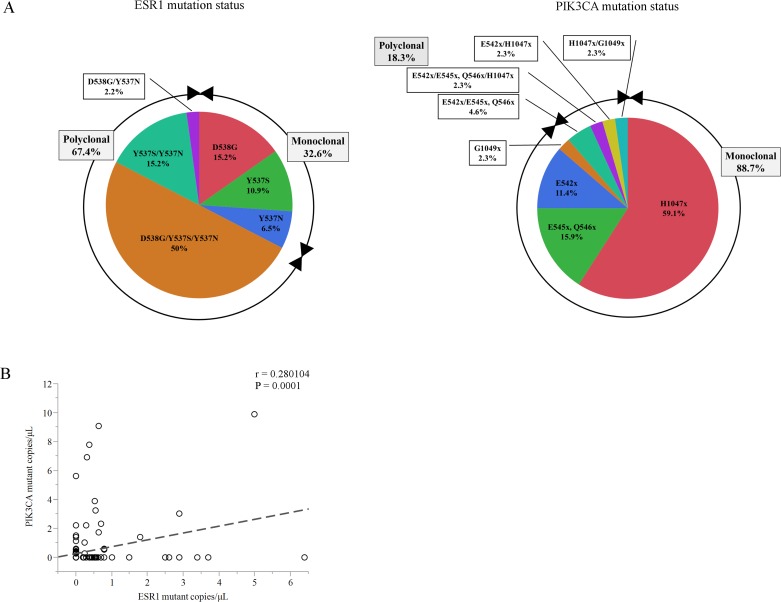
Figure 2.
A. Chart showing the percentage of ESR1 mutations and PIK3CA mutations in plasma cfDNA in this cohort. B. Comparison of the number of copies/μL between total ESR1 mutations and total PIK3CA mutations in plasma from a subset of 86 women (185 blood samples). Abbreviations; cfDNA, cell-free DNA; H1047x, H1047L/R/Y; E545x Q546x, E545V/G/A/Q/K Q546L/R/P/E/K; E542x, E542K/V; G1049x, G1049R/S.

