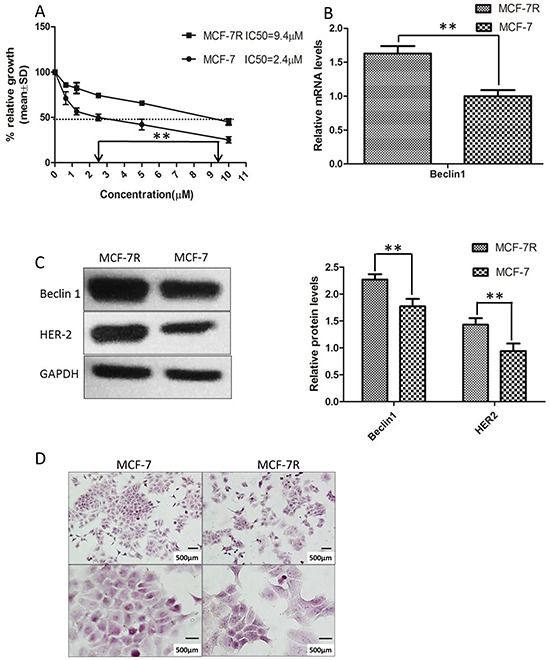
Figure 1. Tamoxifen-resistant MCF-7 cells (MCF-7R) was established and possessed increased levels of Beclin 1 and HER2.

A. Tamoxifen (TAM) IC50 was examined by MTT analysis after incubation of the cells in the indicated concentrations of the drug (0.5–10 μM). The IC50 value for MCF-7 was 2.4 μM and 9.4 μM for MCF-7R. Each data point represent values from three independent experiments (n = 3). The dotted arrow represents where 50% inhibition of growth intercepts with the X axis and was used to estimate the IC50. The statistical significance was determined by the t test (**p<0.01). B. Representative mRNA expression of Beclin 1 in MCF-7R and MCF-7 cell.β-actin was used for normalization. **p < 0.01. C. Western blotting analysis of the protein levels of Beclin 1 and HER2 in MCF-7 cells and MCF-7/R cells (left). All experiments were repeated at least three times, and the quantitative results were analyzed by Image J software (right), and GAPDH was used as an endogenous control. **p < 0.01. D. Cell morphology of MCF-7 cells and MCF-7R cells. Scale bar= 500 μm.
