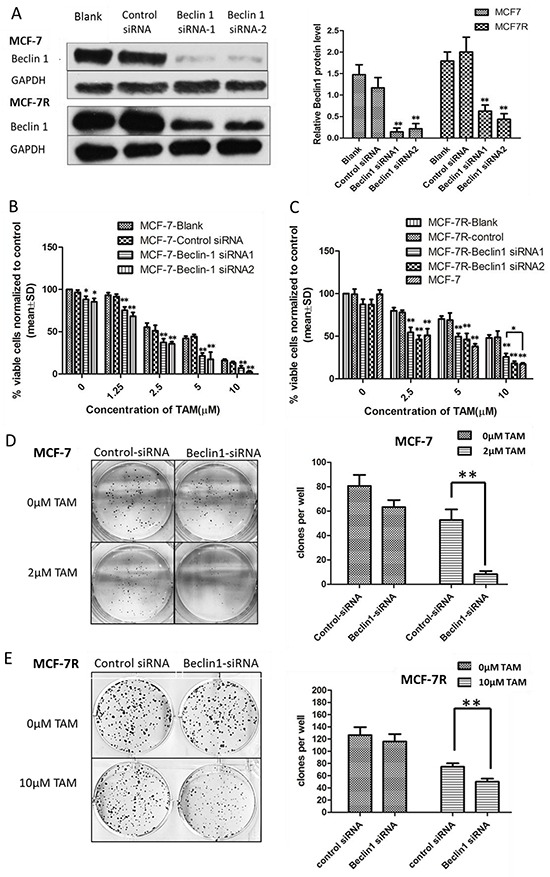
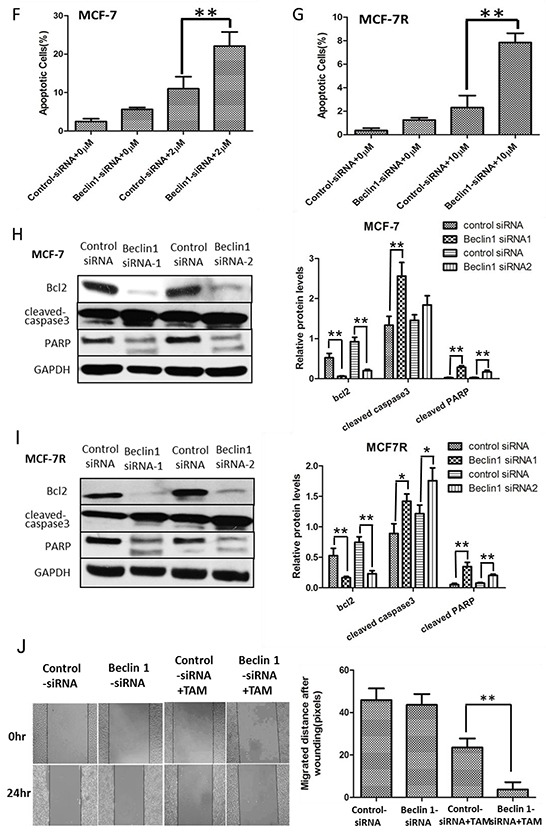
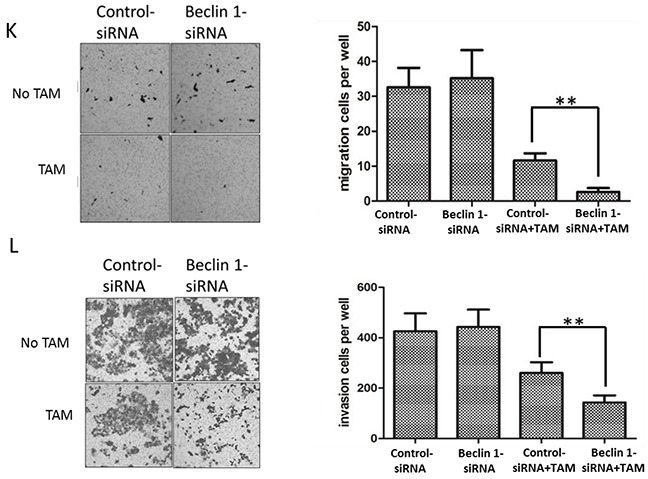
Figure 2. Beclin 1 downregulation led to increased tamoxifen sensitivity of ER-positive breast cancer cells including decelerated proliferation, enhanced cell apoptosis together with lower migration and invasion capability.


A. Western blot for Beclin 1 of MCF-7 cells and MCF-7R cells transfected with Beclin 1 siRNA, control siRNA or no siRNA (left). All experiments were repeated at least three times, and the quantitative results were analyzed by Image J software (right), and GAPDH was used as an endogenous control. **p < 0.01, one-way ANOVA. B-C. MTT assay of proliferation in MCF-7 and MCF-7R cells expressing either Beclin 1 siRNA or control siRNA in the presence of different concentrations of tamoxifen or not. *p<0.05,**p < 0.01, two-way ANOVA. D-E. Colony formation assay. Left panel: Representative photographs of the colony formation assay using MCF-7 and MCF-7R cells expressing either control siRNA or Beclin 1 siRNA in the presence of tamoxifen or not. Right panel:Quantitative analysis of colony formation. F-G. Apoptosis was determined by flow cytometry after 24h tamoxifen treatment, using annexin V and propidium iodide in MCF-7 and MCF-7R cells transfected with control or Beclin 1 siRNA. H-I. Western blot for apoptosis related proteins of MCF-7 and MCF-7R cells transfected with control siRNA or Beclin 1 siRNA in the presence of tamoxifen (left). All experiments were repeated at least three times, and the quantitative results were analyzed by Image J software (right), and GAPDH was used as an endogenous control. **p<0.01. J. Wound healing assay. Representative image of wound healing assay of MCF-7 cells transfected with control siRNA or Beclin 1 siRNA in the presence of tamoxifen or not (left). Quantitative analysis of the wound closure distance (right). K-L. Transwell assay. Representative image of Transwell migration or invasion assays of MCF-7 cells with control siRNA or Beclin 1 siRNA in the presence of tamoxifen or not (left). Quantitative analysis of the migration or invasion rates. Data were shown as means ± S.D. from triplicate experiments (right). For D-L, **p<0.01, Student's t-test.
