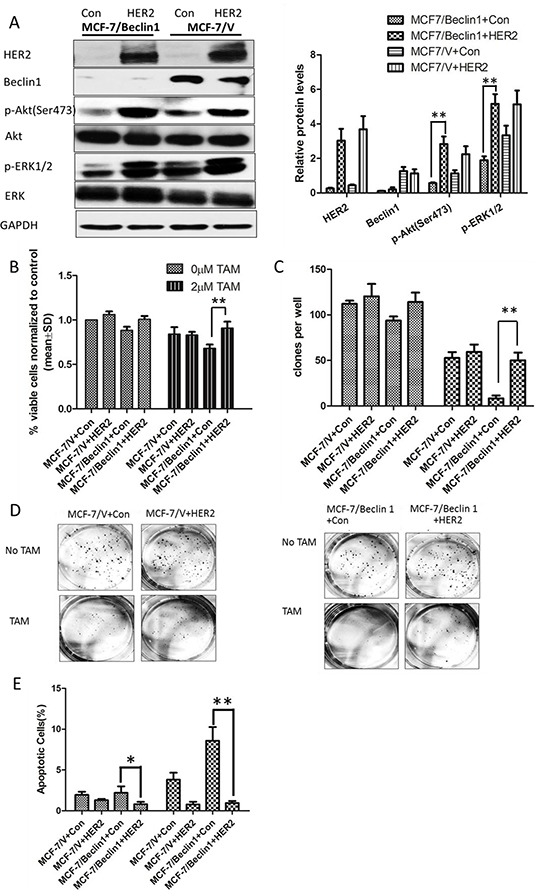
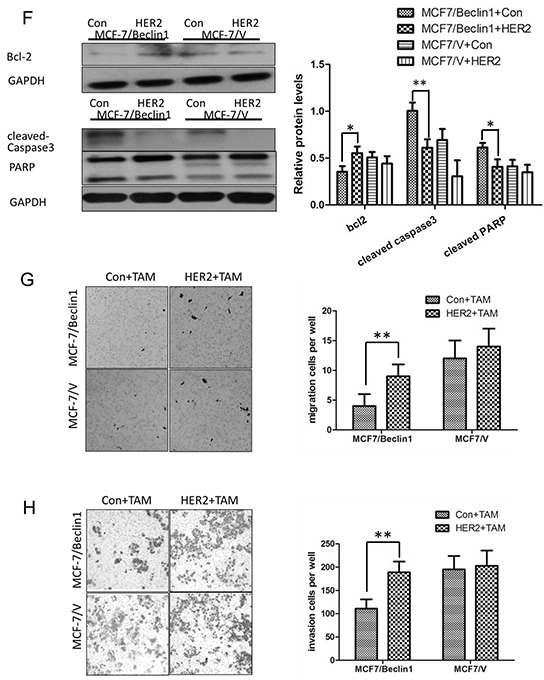
Figure 4. Overexpression of HER2 in Beclin 1 knockdown breast cancer cells showed lower TAM sensitivity.


A. Western blotting analysis of the protein levels of Beclin 1, HER2, phosphorylated Akt, total Akt, phosphorylated ERK1/2 and total ERK1/2 in MCF-7/V cells and MCF-7/Beclin 1 cells overexpressed HER2 or not, in the presence of tamoxifen. GAPDH was used as the loading control. The representative results were shown in the left panel, and the quantitative results analyzed by Image J software were shown in the right panel. **p<0.01, one-way ANOVA. B. MTT assay of proliferation in MCF-7/V cells and MCF-7/Beclin 1 cells overexpressed HER2 or not in the presence of tamoxifen or not. **p < 0.01, two-way ANOVA. C. Quantitative analysis of colony formation. **p < 0.01, two-way ANOVA. D. Representative photographs of the colony formation assay in MCF-7/V cells and MCF-7/Beclin 1cells overexpressed HER2 or not in the presence of tamoxifen or not. E. Apoptosis was determined by flow cytometry after 24 h tamoxifen treatment, using annexin V and propidium iodide in MCF-7/V cells and MCF-7/Beclin 1 cells overexpressed HER2 or not. **p < 0.01, two-way ANOVA. F. Western blot for apoptosis related proteins of MCF-7/V cells and MCF-7/Beclin 1 cells overexpressed HER2 or not in the presence of tamoxifen. The representative results were shown in the left panel, and the quantitative results analyzed by Image J software were shown in the right panel. *p<0.05,**p<0.01, one-way ANOVA. G-H. Transwell assay. Representative image of Transwell migration or invasion assays of MCF-7/V cells and MCF-7/Beclin 1 cells overexpressed HER2 or not in the presence of tamoxifen (left). Quantitative analysis of the migration or invasion rates. Data were shown as means ± S.D. from triplicate experiments (right). **p<0.01, one-way ANOVA.
