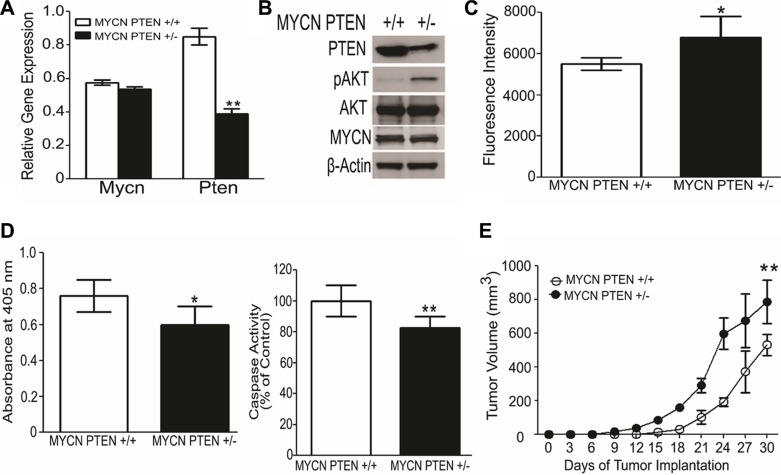
Figure 3. Loss of one allele of PTEN promotes neuroblastoma growth in mice.
(A) Quantitative RT-PCR shows lower Pten mRNA in neuroblastoma-derived cell lines obtained from MYCN PTEN+/− compared with MYCN PTEN+/+ mice. Mycn mRNA levels were similar between the two lines. Values reflect Mycn and Pten mRNA relative to Gapdh, analyzed in triplicate. (B) Western blot analysis showing the protein level of PTEN and MYCN in cell lines obtained from neuroblastomas in MYCN PTEN+/+ and MYCN PTEN+/− mice. (C) Cells from MYCN PTEN+/− mouse neuroblastomas show more rapid increase of viable cell number in culture compared to neuroblastoma cells from MYCN PTEN+/+ mice as analyzed by AlamarBlue® described in Methods. (D) Left panel shows cell death ELISA assay performed on MYCN PTEN+/+ and MYCN PTEN+/− neuroblastoma cells according to manufacturer's protocol. Right panel shows caspase 3 activity done in triplicates in MYCN PTEN+/+ and MYCN PTEN+/− neuroblastoma cells. (E) 5 × 10⁶ tumor derived neuroblastoma cell lines obtained from MYCN PTEN+/+ and MYCN PTEN+/− mice were inoculated subcutaneously in nude mice (n = 7–8 mice per group). Graphs present mean ± SEM of 7–8 mice. Statistical significance is assessed by two sample t-test where *denotes P < 0.05, ** denotes P < 0.01 and *** denotes P < 0.001.

