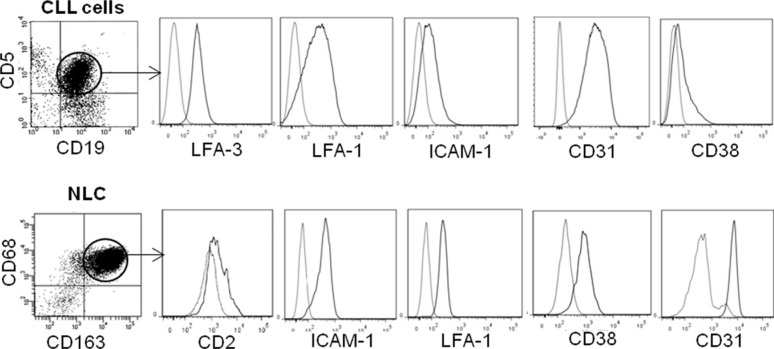
Figure 3. Expression of adhesion membrane proteins by NLC and CLL cells.
Flow cytometry analysis of adhesion molecules (black line) expressed by gated CLL cells from CLL patient's PBMC (upper) and by gated NLC from a 10 days culture with the same CLL patient's PBMC (lower), compared to isotopic control (grey line).

