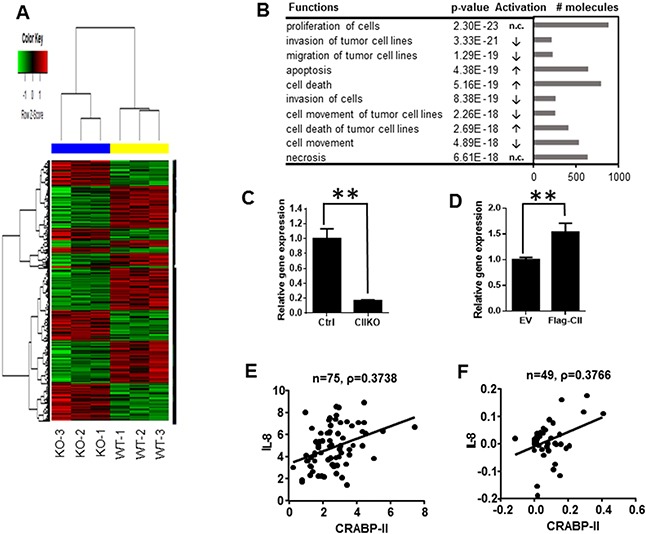
Figure 4. Down-regulation of IL-8 in CRABP-II knockout cells.

A. Heat map of gene expression microarray. 1895 down-regulated genes and 1478 up-regulated genes upon CRABP-II deletion in Panc-1 cells were shown. B. Molecular and cellular function analysis by IPA software (Qiagen). The top 10 functions were listed. The arrows in activation column indicate functions in CIIKO cells compared to WT cells, “increase (↑)”, “decrease (↓)” or “no change (n.c.)”. C. qRT-PCR showing decrease of IL-8 expression in CRABP-II KO cells. Data were normalized to actin mRNA and represent the means ± SD of three biological replicates. ** p<0.01 by student t-test. D. qRT-PCR showing increase of IL-8 expression in flagged CRABP-II expressing cells. Data were normalized to actin mRNA and represent the means ± SD of three biological replicates. ** p<0.01 by student t-test. E and F. Correlation between IL-8 and CRABP-II expression in human pancreatic cancer specimens by Pearson’s product-moment correlation coefficient analysis (PPMCC). Data shown in (E) are combination of Pei Pancreas and Badea Pancreas from Oncomine (n=75) and Pearson correlation coefficient number ρ= 0.3738; Data shown in (F) are from TCGA Pancreas in Oncomine (n=49) and Pearson correlation coefficient number ρ= 0.3766.
