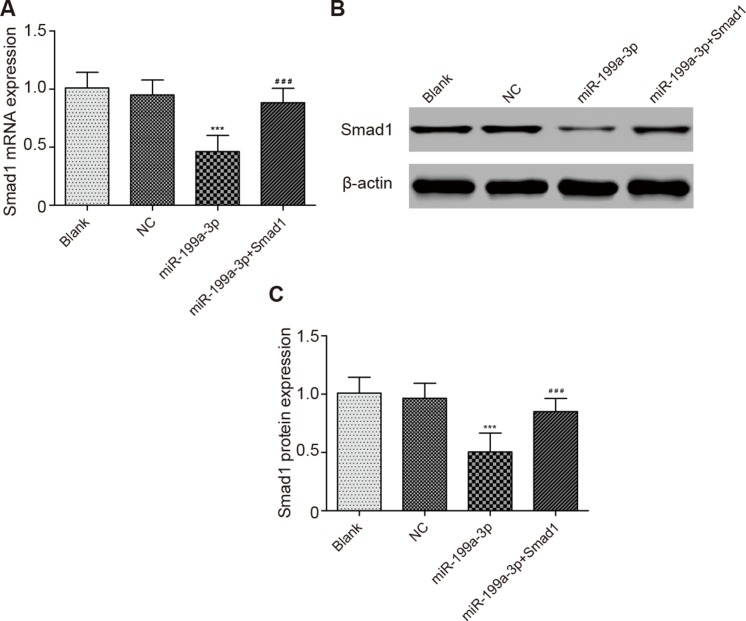
Figure 5. Comparison of Smad1 expressions in different groups.
(A) Comparison of Smad1 mRNA expression in different groups. (B) The effect of miR-199a-3p transfection on the PC-3 cells was detected by Western blotting assay. (C) Comparison of Smad1 protein expression in different groups. Data were presented as mean ± SD. ***P < 0.001 compared with NC group; ###P < 0.001 compared with miR-199a-3p group.

