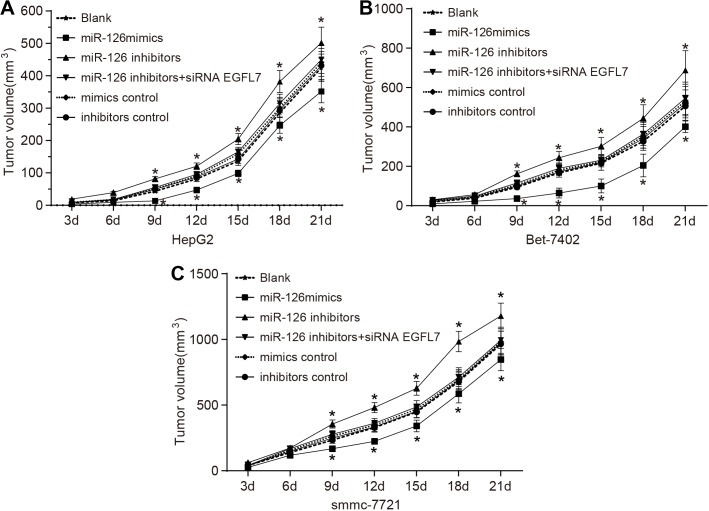
Figure 8. Tumor growth curves of nude mice transplanted with smmc-7721, Bet-7402 and HepG2 cell lines in the blank, miR-126 mimics, miR-126 inhibitors, miR-126 inhibitors + siRNA EGFL7, mimics control and inhibitors control groups.
(A). tumor growth curves of mice transplanted with HepG2 cells in each group; (B). tumor growth curves of mice transplanted with Bet-7402 cells in each group; (C) tumor growth curves of mice transplanted with smmc-7721 cells for each group; *P < 0.05 compared with the blank group; miR-126, microRNA-126; EGFL7, epidermal growth factor-like domain 7.

