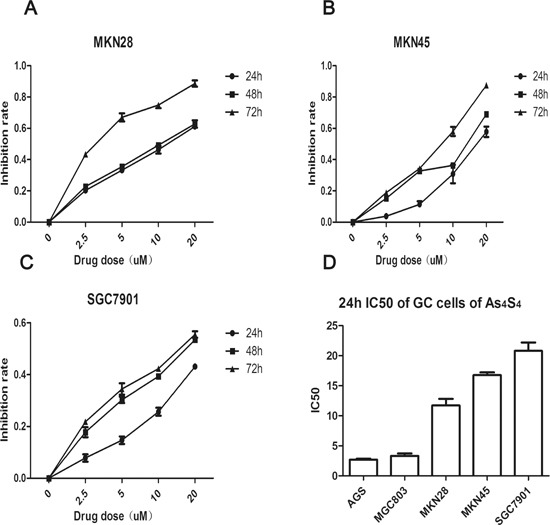
Figure 1. Curves of cell inhibition rates in gastric cancer cells treated with As4S4.

(A-C) Dose-and time-dependent curves of cell inhibition rates in cells treated with As4S4, (A-C) represent MKN28, MKN45, SGC7901, respectively. (D) The comparisons of the IC50 to As4S4 of five gastric cancer cells. Data represent the mean ± standard deviation of three independent experiments.
