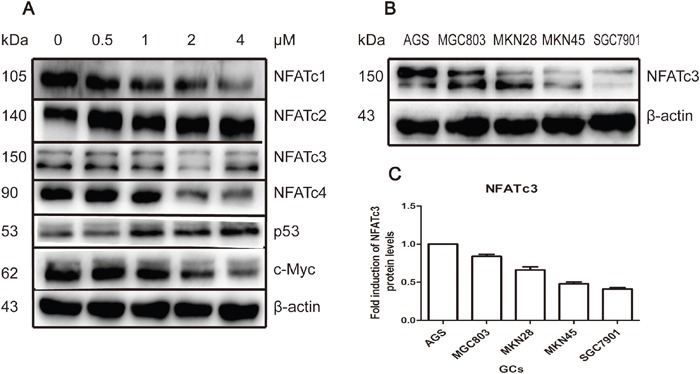
Figure 2. As4S4 modulated the NFAT protein level; the baseline expression of NFATc3 among GC cell-lines.

(A) AGS cells were treated with As4S4 in different concentration for 24 hours and NFATc1, NFATc3, NFATc4 and c-Myc were down-regulated while NFATc2 and p53 were up-regulated. (B) The baseline expression of protein NFATc3 in AGS, MGC803, MKN28, MKN45 and SGC7901 cells was various distinctly. (C) Protein quantification of the Western blot results shown in (B), NFATc3 protein levels were normalized to the β-actin levels and are shown as fold changes relative to the levels of AGS which is as control strain.
