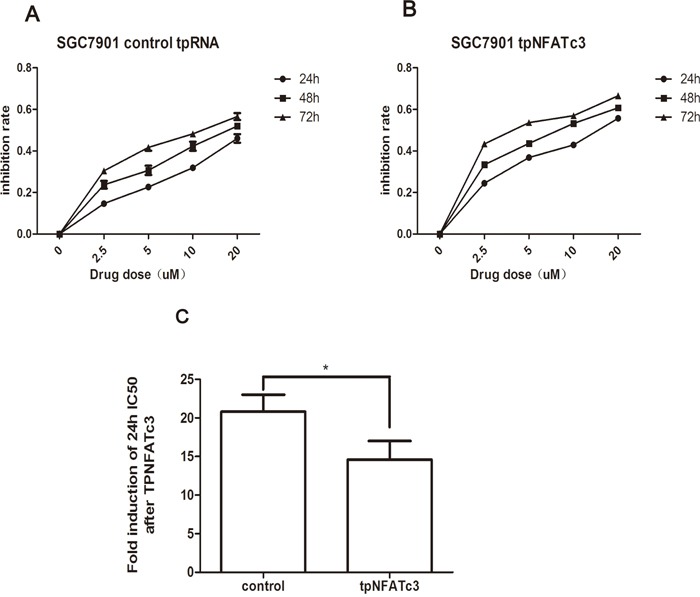
Figure 6. Curves of cell inhibition rates in SGC7901 cell treated with As4S4 after the transfection of the plasmid carrying NFATc3 tpRNA.

(A) Dose- and time-dependent curves of cell inhibition rates in cells treated with As4S4 after the transfection of the plasmid carrying control tpRNA. (B) Dose- and time-dependent curves of cell inhibition rates in cells treated with As4S4 after the transfection of the plasmid carrying NFATc3 tpRNA. (C) The fold change of 24h IC50 of SGC7901 cells to As4S4 after the transfection of the plasmid carrying NFATc3 tpRNA. *P < 0.05.
