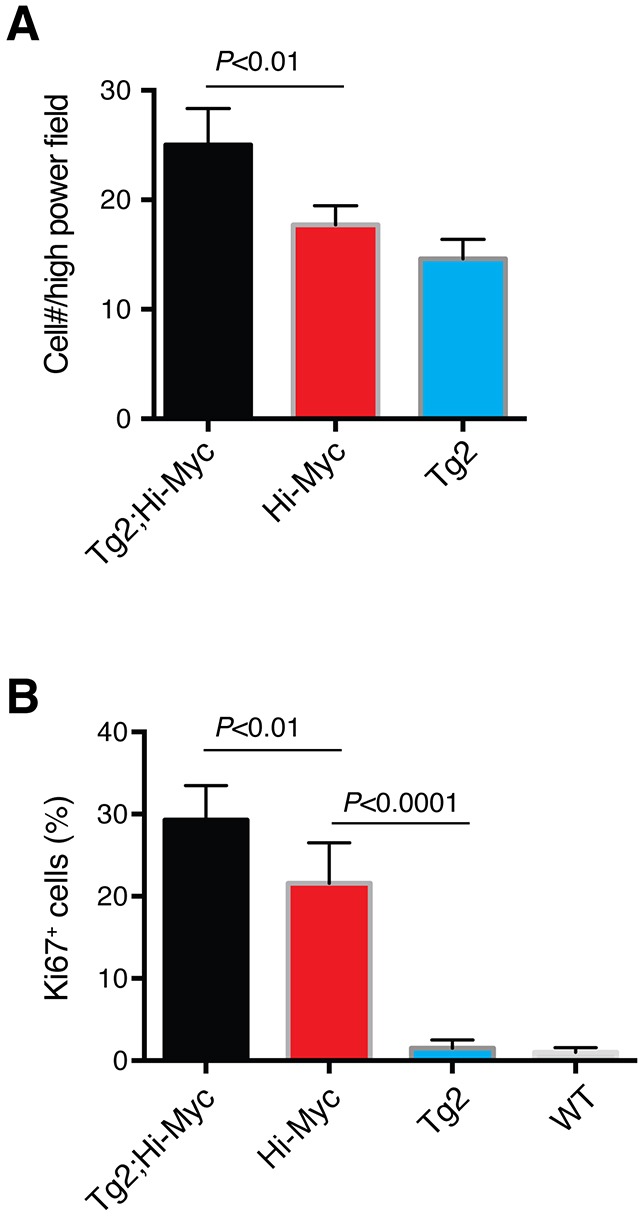
Figure 7. Quantification of proliferation (i.e., Ki67+ cells) in the VP lobes of different mice.

(A) Bar graph presentation of cell numbers per 200x microscopic field in the VPs of three genotypes of mice. (B) Bar graph presentation of the % of Ki67+ cells in the VPs of 3 genotypes of mice.
