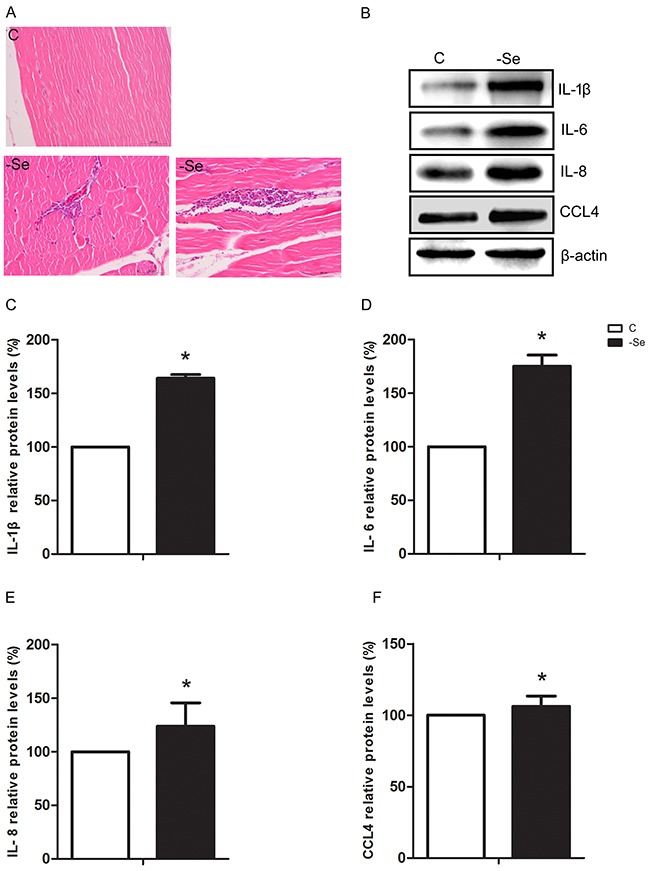
Figure 1. Se deficiency caused inflammation response in chicken muscles.

(A) Photomicrograph of C group and -Se group muscles, ×400. Upper panel represented the photomicrographs of C group muscle, and lower panels represented the photomicrographs of -Se group muscle. (B) The protein expressions of IL-1β, IL-6, IL-8, and CCL4 in the C group and -Se group muscles. (C-F) Data presented the relative expressions of IL-1β, IL-6, IL-8, and CCL4 protein levels (standardized to the intensity of β-actin). The data are expressed as the means ± SD.* Significant difference from the corresponding control (P<0.05).
