
Figure 6. QPCR validation of the profiles lncRNAs and mRNAs.
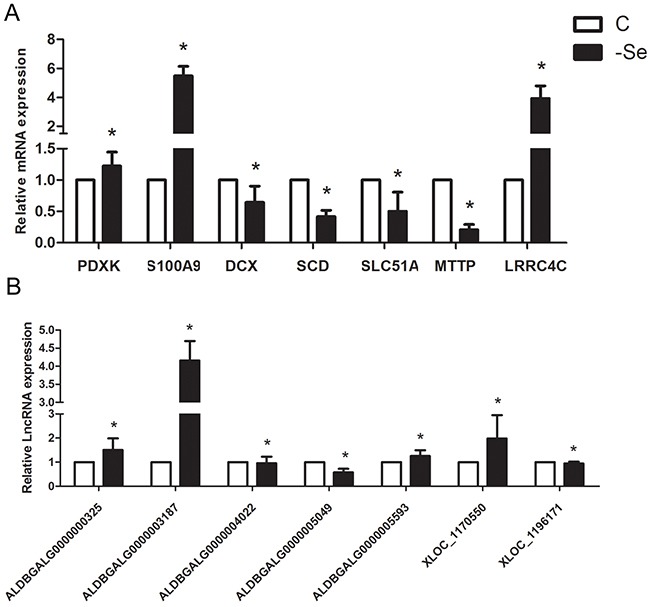
(A) The expression levels of mRNAs. (B) The expression levels of lncRNAs. The data are expressed as the means ± SD.* Significant difference from the corresponding control (P<0.05).
Official websites use .gov
A
.gov website belongs to an official
government organization in the United States.
Secure .gov websites use HTTPS
A lock (
) or https:// means you've safely
connected to the .gov website. Share sensitive
information only on official, secure websites.
(A) The expression levels of mRNAs. (B) The expression levels of lncRNAs. The data are expressed as the means ± SD.* Significant difference from the corresponding control (P<0.05).