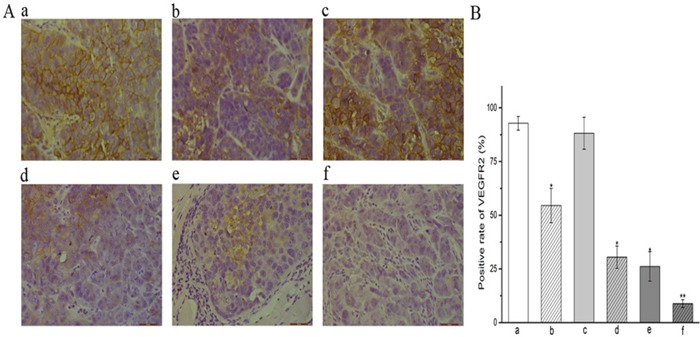
Figure 2. Expression of VEGFR-2 in CNE-2 NPC tumor tissue.

(A) Immunohistochemical staining of xenografted CN-2 NPCs treated with various treatment regimens with a VEGFR-2 antibody label (x400 magnification). (B) VEGFR2 positivity (%) within treatment groups.* P < 0.05 vs. control group. ** P < 0.05 vs. all groups. (a) control group; (b) YN968D1 group; (c) DDP group; (d) YN968D1 first group; (e) DDP first group; (f) YN968D1 + DDP group.
