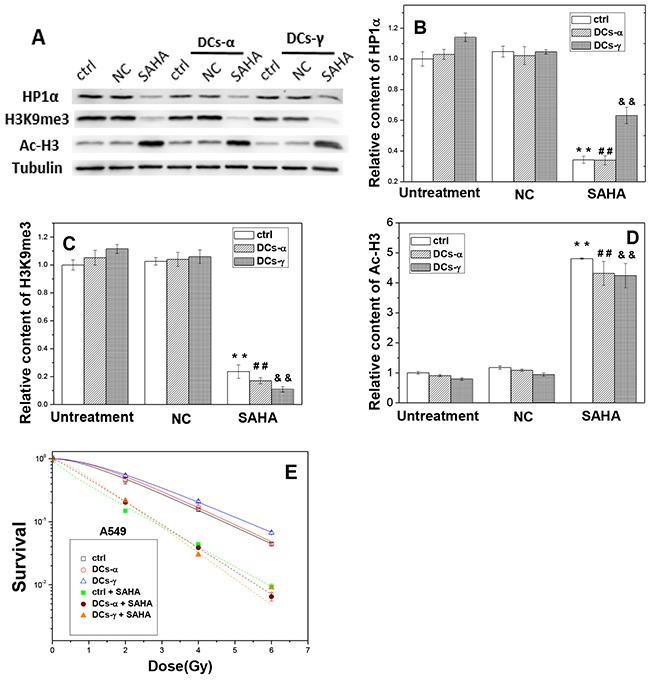
Figure 7. The treatment of cells with SAHA decreases the level of heterochromatin and increases radiosensitivities of DCs-α and DCs-γ of A549 cells.

DCs were treated with 2 μM SAHA for 12 h. (A) Western blotting image of HP1α, H3K9me3 and Ac-H3 in DCs and its parent control. Ctrl: control cells with irradiation; NC: negative control of SAHA. (B, C, D) Relative expression levels of HP1α, H3K9me3 and Ac-H3 in the DCs and its parent control cells with and without SAHA treatment. Tubulin was used as an internal reference. **, ## and &&, P < 0.01 compared to corresponding NC group. (E) Dose responses of the survival of DCs and its parent control with or without SAHA treatment. Cells were irradiated with different test doses of γ-rays. Data were presented as means ± SEMs of three independent experiments.
