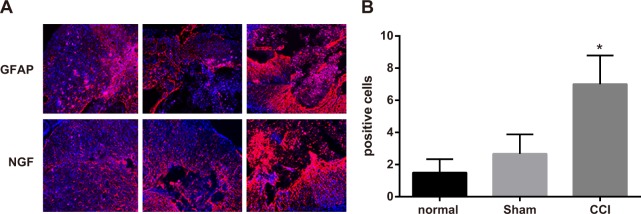
Figure 3. Expressions of glial fibrillary acidic protein (GFAP) and nerve growth factor (NGF) detected by immunofluorescence assay among the control, sham and chronic constriction injury (CCI) groups.
Note: (A) expressions of GFAP and NGF in each group detected by immunofluorescence assay, Scale bar = 20 μm (× 400); (B) comparison of relative integrated optical density (IOD) value in each group; *, P < 0.05 in comparison with the sham group.

