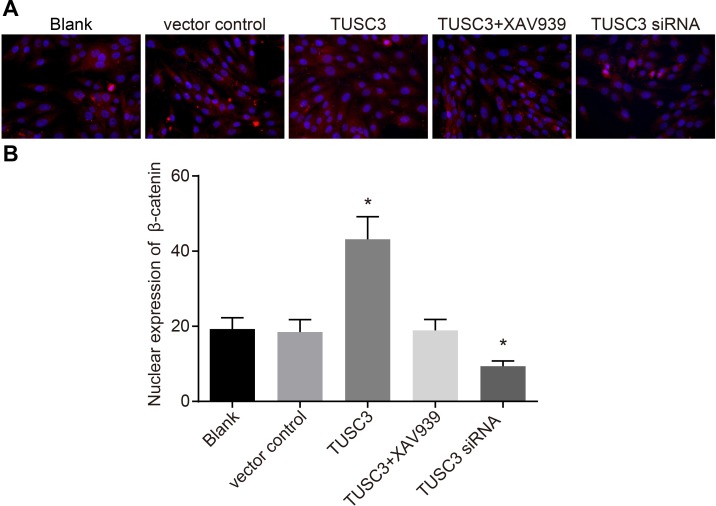
Figure 10. Immunofluorescence analysis ofβ-catenin expression in the blank, vector control, TUSC3, TUSC3 + XAV939, and TUSC3 siRNA groups.
(A) Fluorescence images showing expression of β-catenin in the five groups; (B) histograms showing expression of β-catenin in the five groups; *, P < 0.05 compared to the blank and vector control groups; TUSC3, tumor suppressor candidate 3.

