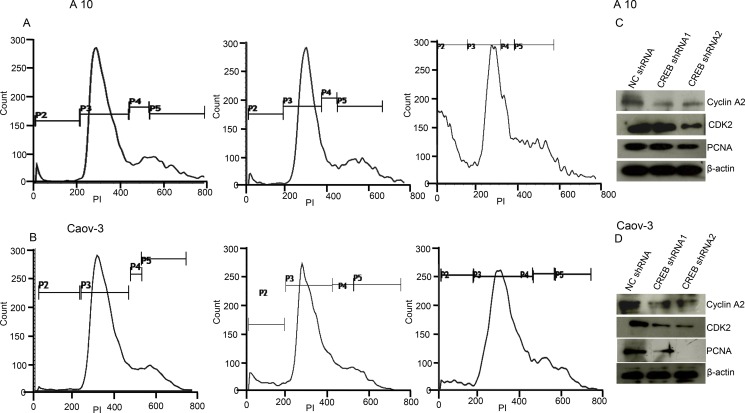
Figure 7. CREB knockdown mimics AKAP4 ablated phenotype in A10 and Caov-3 cells.
(A and B) Histogram shows s-phase cell cycle arrest after CREB ablation in A10 and Caov-3 cell after PI staining at 48 hr. (C and D) Western blot analysis shows s-phase specific molecules along with PCNA. β- actin serves as loading control. The data shown as mean ± standard error of the mean (SEM) of three independent experiments. *P < 0.05; **P < 0.01.

