
Figure 7. Pitavastatin induction of acinar differentiation genes.
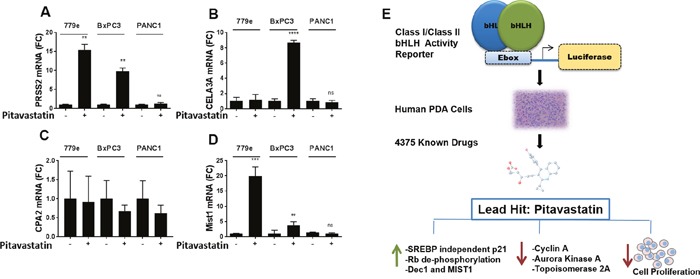
BxPC3, PANC1 and 779e cells treated with 10 μM pitavastatin for 48hr were harvested for RT-qPCR analysis of acinar differentiation markers: (A) PRSS2, (B) CELA3A, (C) CPA2 and (D) MIST1. Data are represented as mean +/−SD, *p≤0.05, **p≤0.01, ***p≤0.001, ****p≤0.0001. (E) A graphic model describing assay development, drug discovery and mechanistic studies with statins.